
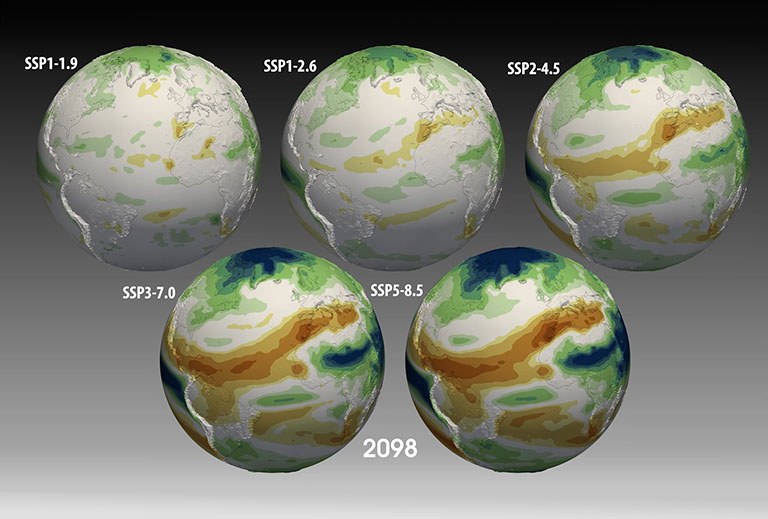
Video 1: Seasonal changes in precipitation projected for the "1.5°C scenario" SSP1-1.9 for the period 2071-2100 compared to values simulated for 1995-2014. This scenario was simulated by only a subset of the models, so the signal-to-noise ratio here is less good; moreover, the mean end-of-century warming in this scenario relative to the comparison period is only about 0.5°C, so only relatively small further changes (compared to those achieved today relative to the pre-industrial situation) are simulated. Nevertheless, a clear pattern can already be seen.
Video 2: Seasonal changes in precipitation projected for the "2°C scenario" SSP1-2.6 for the period 2071-2100 compared to the values simulated for 1995-2014. This scenario is roughly equivalent to the CMIP5 scenario RCP2.6.
Video 3: Animation of the seasonal changes in precipitation projected for the SSP2-4.5 medium scenario for the period 2071-2100 compared to the values simulated for 1995-2014.
Video 4: Animation of the seasonal changes in precipitation projected for the moderate pessimistic scenario SSP3-7.0 for the period 2071-2100 compared to the values simulated for 1995-2014.
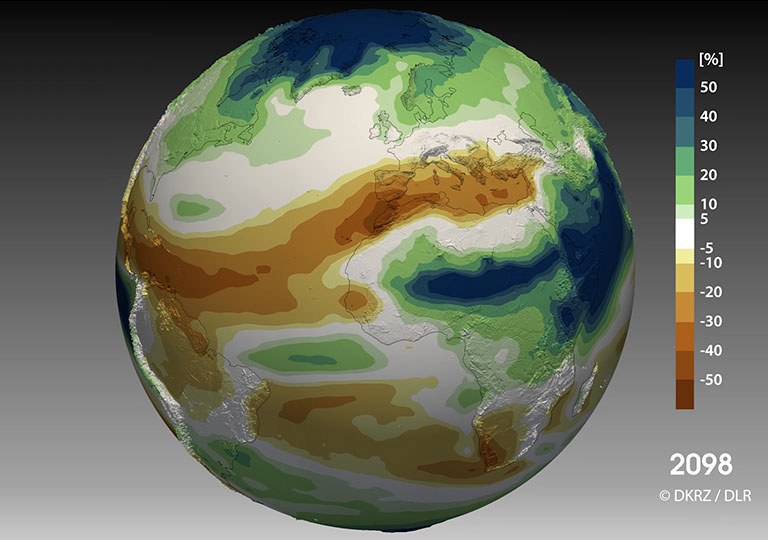
Video 5: Seasonal changes in precipitation projected for the pessimistic scenario SSP5-8.5 for the period 2071-2100 compared to the values simulated for 1995-2014.
Visualization: Michael Böttinger, DKRZ
Data preparation: Axel Lauer and Veronika Eyring, DLR
Literature: Tebaldi et al. 2021, Earth Syst. Dynam., 12, 253–293, 2021, https://doi.org/10.5194/esd-12-253-2021
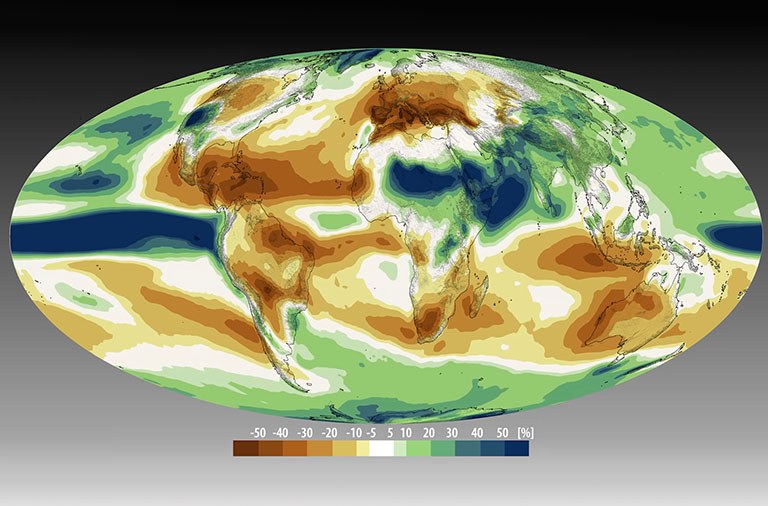
Seasonal CMIP6 ensemble precipitation changes (Mollweide)
For each of the 5 simulated SSP scenarios, a visualization using the Mollweide projection shows the seasonal cycle of the mean monthly percent precipitation changes projected by the CMIP6 multi-model ensemble for the end of the century (2071-2100) relative to precipitation calculated for the 1995-2014 period