In addition to the main scenarios simulated for ScenarioMIP, SSP1-2.6, SSP2-4.5, SSP3-7.0, and SSP5-8.5 ("Tier 1 Experiments"), some centers have also conducted simulations for the climate change scenario SSP1-1.9. More on that is available here and here.
On this page, we present a direct comparison of the temporal development of projected percent precipitation changes based on annual mean precipitation simulated by the CMIP6 ensemble versus the simulated 1995-2014 period for these scenarios. Since the annual mean precipitation of the ensemble mean data varies quite a bit in time, a 5-year moving average was previously used for temporal smoothing. This has the advantage that the simulated natural variability here no longer detracts as much from the long-term climate change signal.
All visualizations of the results of the mean of all CMIP6 models presented here were produced at DKRZ. The multi-model means were calculated and provided using the Earth System Model Evaluation Tool (ESMValTool) from the German Aerospace Center (DLR).
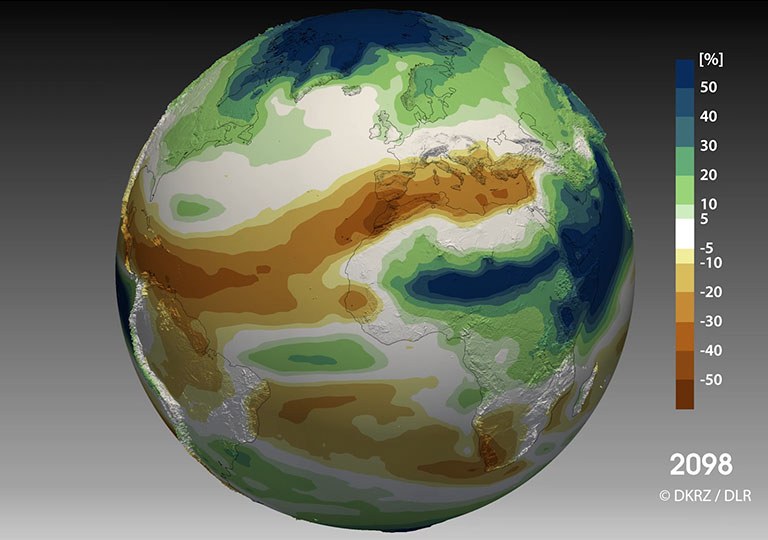
Video 1: Direct comparison of percent changes in annual precipitation for the "2°C scenario" SSP1-2.6 (roughly equivalent to CMIP5 scenario RCP2.6) and the pessimistic scenario SSP5-8.5 (equivalent to CMIP5 scenario RCP8.5) shows the range of scenarios used for the last model intercomparison project CMIP5 and the 5th IPCC report.
Video 2: This visualization shows the expanded range of percent changes in annual precipitation projected by the CMIP6 ensemble for the SSP1-1.9, SSP1-2.6, SSP2-4.5, SSP3-7.0, and SSP5-8.5 scenarios relative to the 1995-2014 period. As expected, a graded amplification of the precipitation change pattern by strength of radiative forcing or level of CO2 concentrations is evident.
Visualization: Michael Böttinger, DKRZ, Data preparation: Axel Lauer and Veronika Eyring, DLR
Literature: Eyring et al. 2016, GMD, 9, 1937-1958, 2016, https://doi.org/10.5194/gmd-9-1937-2016,, Tebaldi et al. 2021, Earth Syst. Dynam., 12, 253–293, 2021, https://doi.org/10.5194/esd-12-253-2021
Literature on ESMValTool: Eyring et al 2020., https://doi.org/10.5194/gmd-13-3383-2020, Lauer et al. 2020, https://doi.org/10.5194/gmd-13-4205-2020, Righi et al. 2020, https://doi.org/10.5194/gmd-13-1179-2020, Weigel et al. 2021, https://doi.org/10.5194/gmd-14-3159-2021
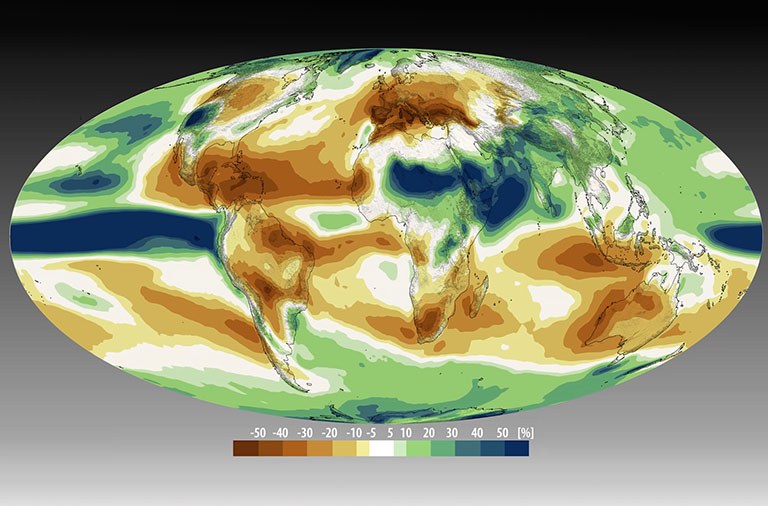
Saisonal CMIP6 ensemble precipitation changes
For each of the 5 simulated SSP scenarios, a visualization using the Mollweide projection shows the seasonal cycle of the mean monthly percent precipitation changes projected by the CMIP6 multi-model ensemble for the end of the century (2071-2100) relative to precipitation calculated for the 1995-2014 period.
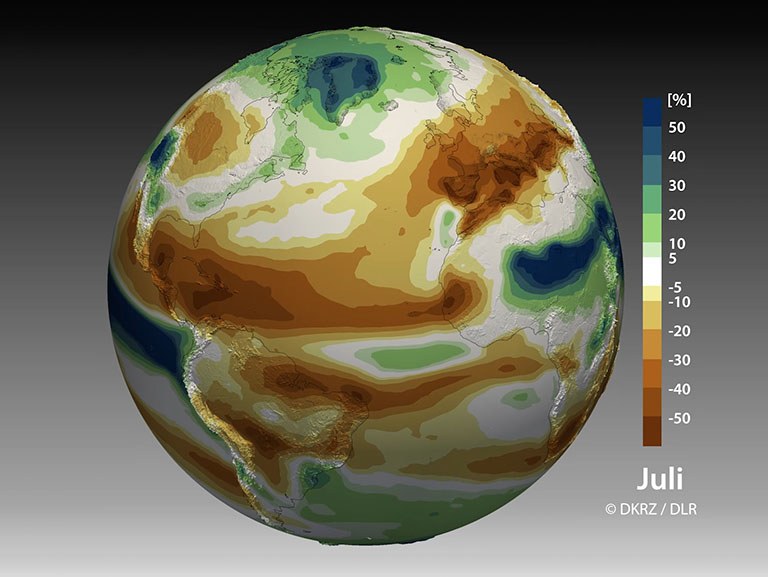
Seasonal CMIP6 ensemble precipitation changes (Globe)
For each of the 5 simulated SSP scenarios, a visualization shows the seasonal cycle of the mean monthly percent precipitation changes projected by the CMIP6 multi-model ensemble for the end of the century (2071-2100) compared to precipitation calculated for the period 1995-2014. The data are shown here on a slowly rotating slightly tilted Earth, so that the range from the tropics to the far north can be viewed particularly well.