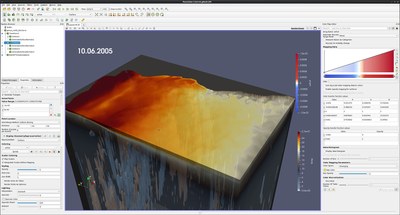
 In climate models, the physical domain of the atmosphere and the ocean is represented by three-dimensional computational grids. The finer the computational grid is, the more realistically can many important phenomena be simulated. Typical data sets with results of climate models are therfore three-dimensional, multivariate and time-dependent. The increasing use of ensemble simulation techniques, where simulations are repeated several times with slightly modified starting values, enables capturing the climate variability and hence adds another dimension to the data. The resulting huge and complex data sets can hardly be evaluated without up-to-date data analysis and visualization tools
Services
To facilitate the interactive work with the model data, DKRZ provides its users with
- access to powerful GPU nodes that are an integral part of the supercomputer
- interactive visualization at home or in your office via remote 3D-rendering
- domain specific data visualization software
- appropriate technical advice and assistance in solving visualization problems
- hands-on tutorial courses
GPU Nodes
GPUs ("graphics processing unit") are dedicated graphics processors that initially were developed for the rendering of computer generated imagery. Due to their high degree of parallelism, today's GPUs are extremely powerful special purpose processors, which are now used high performance computing, machine learning and interactive 3D-visualization. Levante has 60 GPU nodes, each equipped with 4 Nvidia A100 high-performance GPUs.
Visualization Software
Paraview is a public domain 3D visualization solution wich enables the direct 3D visualization of model variables as well as to interactively explore the relations between different quantities of multi varaite data sets by means of linking and brushing.
Met.3D is an open-source visualisation tool for interactive, three-dimensional visualisation of numerical ensemble weather predictions and similar numerical atmospheric model datasets.
With respect to data analysis, additional processing and 2D visualization solutions such as NCL and CDO are also available on the system.
Contact
Examples
In our gallery you will find many example pictures and animations illustrating the use of visualization in climate research.
