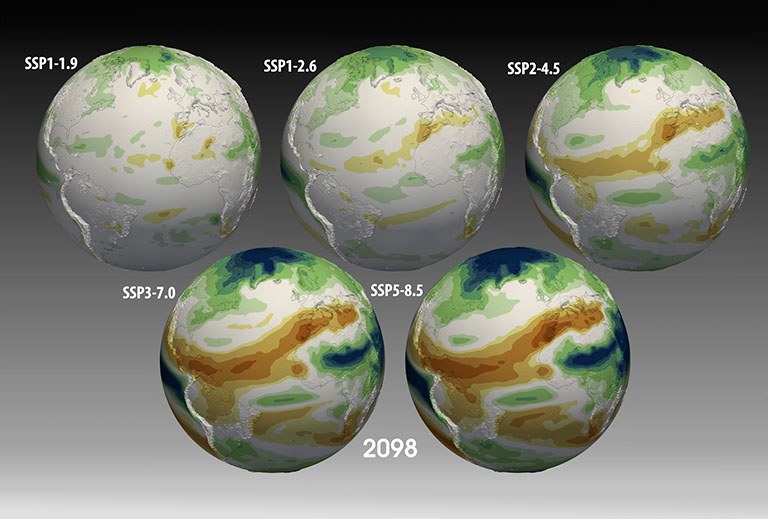
Video 1: Course of changes in mean annual precipitation (5-year moving average) projected for the "1.5°C scenario" SSP1-1.9 compared to values simulated for 1995-2014. This scenario was simulated by only a subset of the models, so the signal-to-noise ratio here is less good; moreover, the end-of-century mean warming in this scenario relative to the comparison period is only about 0.5°C, so that only relatively small further changes (compared to the changes achieved today relative to the pre-industrial situation) are simulated.
Video 2: Course of changes in mean annual precipitation (5-year moving average) projected for the "2°C scenario" SSP1-2.6. This scenario is roughly equivalent to the CMIP5 scenario RCP2.6.
Video 3: Progression of changes in mean annual precipitation (5-year moving average) projected for the SSP2-4.5 medium scenario.
Video 4: Temporoal evolution of the changes in mean annual precipitation (5-year moving average) projected for the moderately pessimistic scenario SSP3-7.0.
Video 5: Progression of changes in mean annual precipitation (5-year moving average) projected for the pessimistic scenario SSP5-8.5.
Visualization: Michael Böttinger, DKRZ
Data preparation: Axel Lauer and Veronika Eyring, DLR
Literature: Tebaldi et al. 2021, Earth Syst. Dynam., 12, 253–293, 2021, https://doi.org/10.5194/esd-12-253-2021
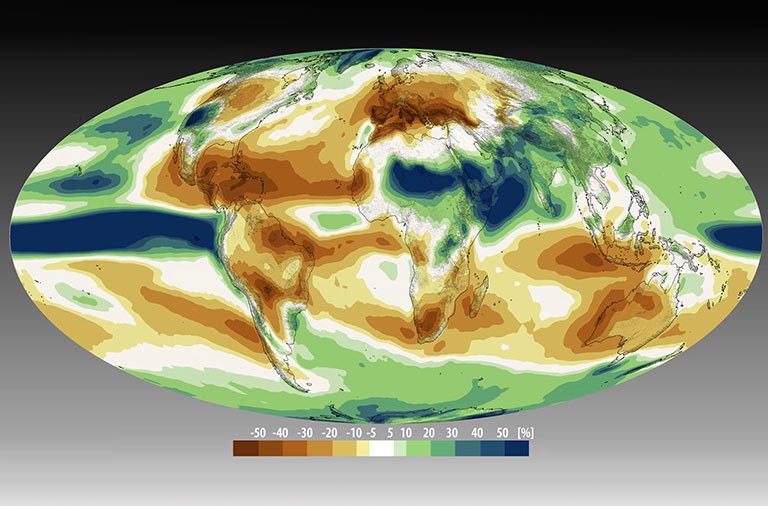
Seasonal CMIP6 ensemble precipitation changes (Mollweide)
For each of the 5 simulated SSP scenarios, a visualization using the Mollweide projection shows the seasonal cycle of the mean monthly percent precipitation changes projected by the CMIP6 multi-model ensemble for the end of the century (2071-2100) relative to precipitation calculated for the 1995-2014 period.
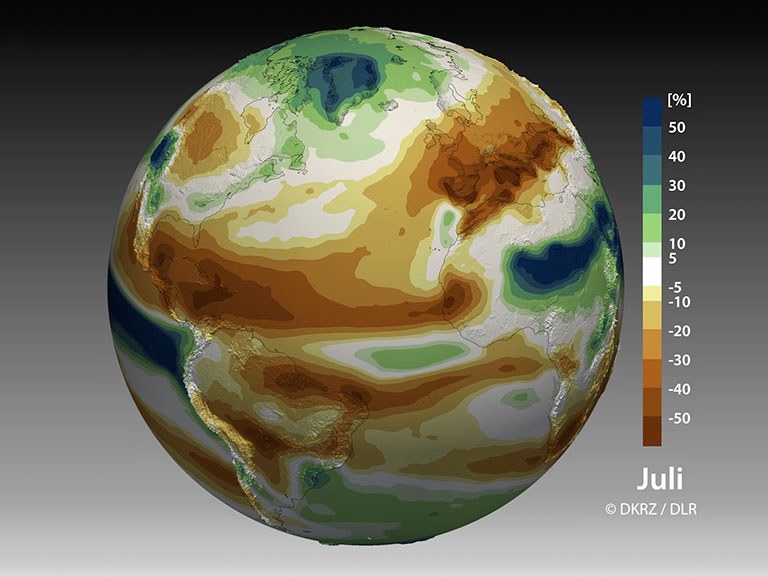
Seasonal CMIP6 ensemble precipitation changes (Globe)
For each of the 5 simulated SSP scenarios, a visualization shows the seasonal cycle of the mean monthly percent precipitation changes projected by the CMIP6 multi-model ensemble for 2071-2100 compared to the period 1995-2014. The data are shown here on a slowly rotating slightly tilted Earth, so that the range from the tropics to the far north can be viewed particularly well.