What Is an Extreme Weather Event?
Extreme weather events include unusually intense rainfall, prolonged droughts, heatwaves, or storms that exceed historical norms in intensity, frequency, or spatial extent. In climate science, these events are statistically evaluated in terms of return periods, spatial footprints, and intensity distributions, often using ensemble simulations and observation-based diagnostics.
In recent years, Europe has faced an uptick in extreme weather events, from record-breaking heatwaves to devastating floods. While extreme weather has always been part of the climate system, a growing body of research points to the fact that climate change is shifting the frequency, intensity, and persistence of such events. Yet, not every extreme is caused by human-induced climate change. Disentangling natural variability from anthropogenic influence remains one of the key challenges in climate science today.
To improve understanding of extreme weather events in the context of climate change, projects like ClimXtreme, funded by Germany's Federal Ministry of Education and Research (BMBF), have been established. ClimXtreme provides a multidisciplinary framework to understand and quantify changes in climate extremes across Germany. It brings together expertise in atmospheric science, statistical modelling, and impacts research, organized across four modules: physical processes (A), statistical evaluation (B), impacts (C), and data/infrastructure (D).
One structural element of ClimXtreme II is the Post-Event Analysis Group (PostAG), a cross-module task force that quickly mobilizes to evaluate recent extreme weather events from multiple scientific perspectives. This mechanism ensures rapid, coordinated analysis of notable extremes — like the two major hydro-meteorological events Germany experienced in late 2023 and May/June 2024.
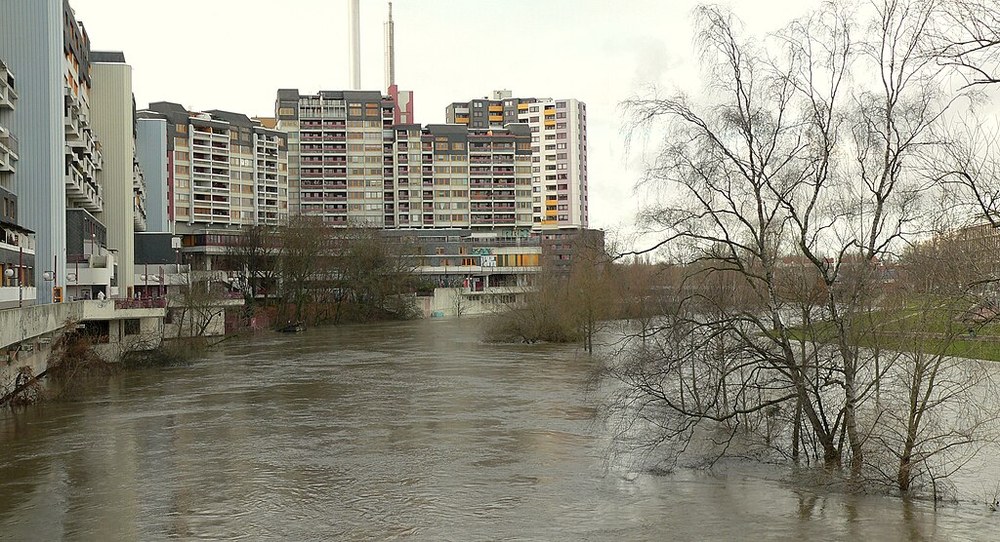
Figure 1: Effects of the winter flood 2023/24 — Flooding of the Ihme River at the Ihmezentrum Hannover in December 2023 (© photo: Axel Hindemith, Licence: Creative Commons by-sa-3.0 de).
The Christmas Floods of 2023–2024: A Persistent Winter Soaking
Over the Christmas holidays of 2023, northwestern Germany was drenched by a seven-day stretch of persistent rainfall, followed by additional wet spells through early January. The rainfall wasn’t particularly extreme on any single day, but its long duration and large spatial extent led to widespread flooding, especially in Lower Saxony, Bremen, and surrounding areas.
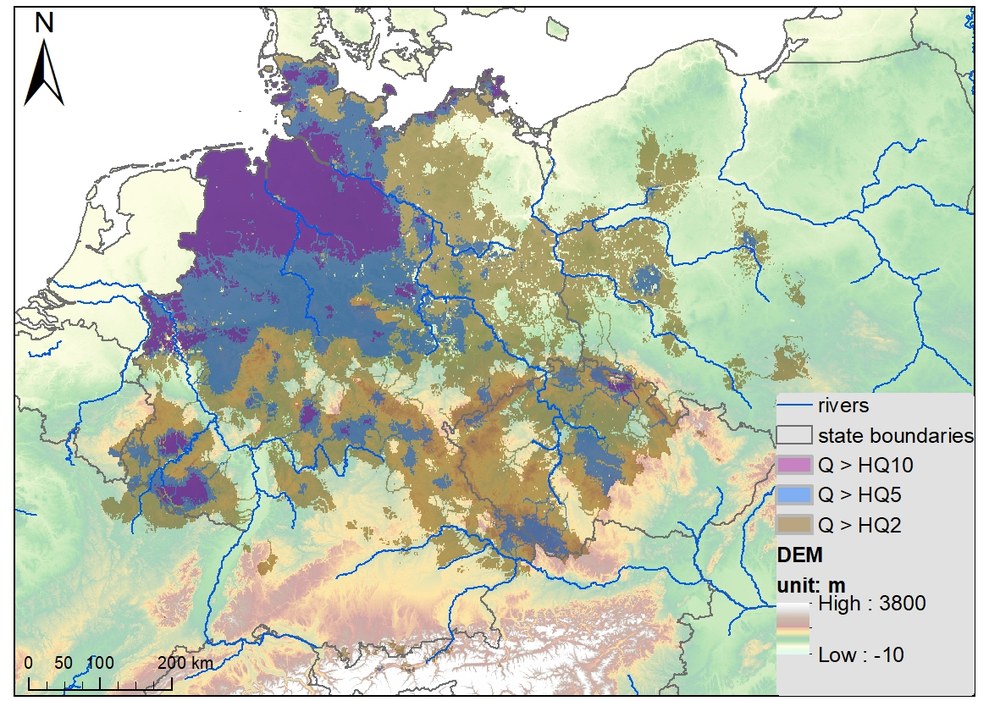
Figure 2: Spatial extent of the winter flood 2023/24 — In the coloured areas, the discharge peaks in the 14-day period around 25 December 2023 exceeded the threshold values of the return periods of 2, 5 and 10 years (HQ2, HQ5, HQ10). (Grieger et al. 2024, Fig. 9)
What caused the flooding?
Meteorologically, the event was linked to a stationary low-pressure system over southern Scandinavia, a configuration not unusual by itself, but one that persisted unusually long—an anomaly seen in only 3% of similar cases since 1940. The discharge area spanned over 100,000 km², ranking the flood among Germany’s top 10 winter flood events in spatial extent since 1955.
Through Precipitation Severity Index (PSI) analysis, researchers found that spatial extent of the precipitation and the combined impact of three consecutive rain episodes made the situation worse. The Christmas rainfall had a ~100-year return period in certain regions. The interaction with two additional rain events created an overall precipitation sequence for more than two weeks on the order of a century-scale event in some areas like the Harz Mountains.
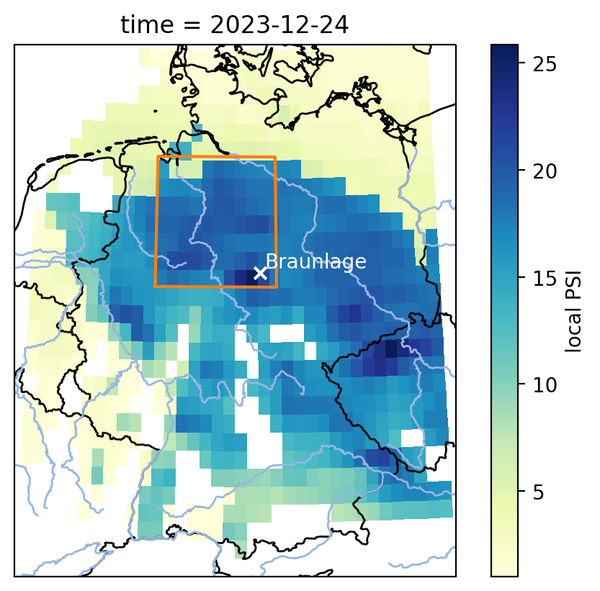
Figure 3: Precipitation Severity Index (PSI) — Map of PSI for 18–24 December 2023, showing extreme persistent precipitation across Lower Saxony. Data from ERA5 analysis. (Grieger et al. 2024, Fig. 1)
Impacts and climate connection
Although only isolated gauges recorded extreme river levels, the spatial coverage of the floods posed a serious challenge to emergency services. Estimates suggest that between 18,000 and 30,000 people and around 2,000 buildings were affected. An attribution study by the German Weather Service (DWD) concluded that climate change made such a monthly precipitation event about 1.8 times more likely (range 0.1 to 140), with a 5% increase in intensity (range -7% to 21%) compared to a preindustrial climate.
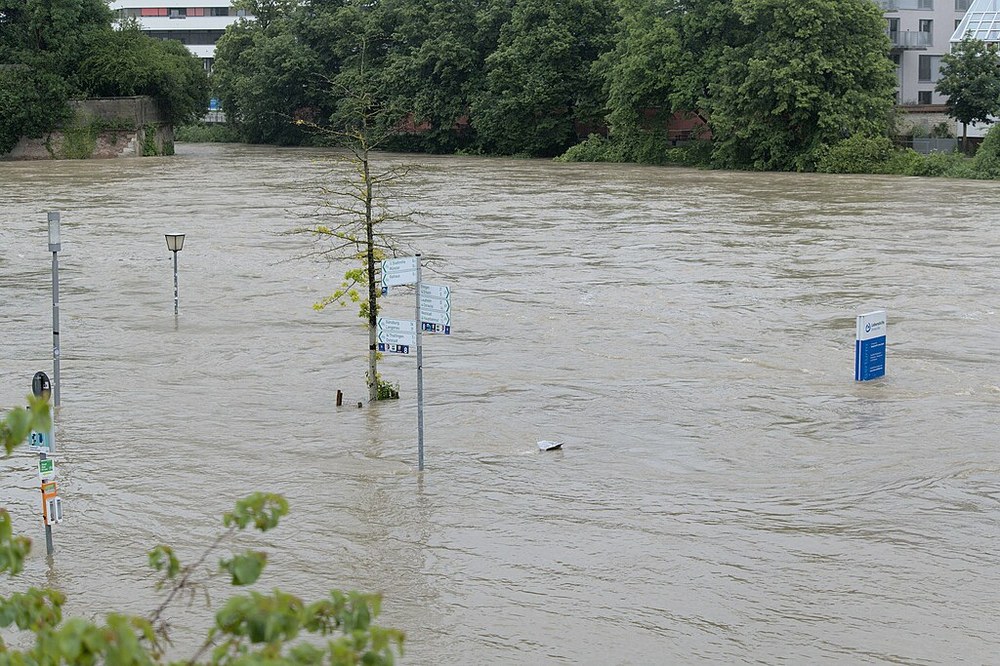
Figure 4: Effects of the flood of May-June 2024 — Flooding of the Danube on June 1, 2024, in Ulm and Neu-Ulm. The meadows along the riverbanks of Danube are flooded as you can see from the cycle path sign (© photo: -stk, Licence: Creative Commons Attribution-Share Alike 4.0 International).
The May–June 2024 Floods in Southern Germany: A Hydrological Flashpoint

Figure 5: Spatial and Temporal Scales of the May-June 2024 rainfall event — The dominant spatial and temporal scales of the May–June 2024 heavy rainfall event, based on hourly RADOLAN-RW data. Areas with less than 50 mm total precipitation during the event period (30 May–4 June) are excluded. The spatial map (left) shows where short- or long-duration rainfall dominated, while the wavelet energy time series (center) and spatio-temporal decomposition (right) reveal how rainfall intensity was distributed across different timescales and regions. (Friederichs et al. 2024, Fig. 6)
Between May 30 and June 6, a prolonged rainfall event caused severe flooding across Bavaria, Baden-Württemberg, and parts of eastern Germany. The precipitation was associated with a stationary, large-scale weather pattern over Europe and driven by a sequence of low-pressure systems (Quirina and Radha), which led to widespread, long-lasting rainfall. In several regions, the event was further intensified by convective activity, resulting in precipitation patterns that varied across spatial and temporal scales.
Rainfall totals exceeded 250 mm within six days in some areas. Centennial return levels were reached in an area of large spatial extent with prolonged duration. The combination with the spatial alignment of the precipitation relative to orography and river catchments made the event hydrologically exceptional. It produced the second-largest flood discharge anomaly in the region over the past 100 years—second only to the 2013 flood. Simulated runoff responses in small catchments indicated return periods well beyond 100 years, underscoring the rare and impactful nature of the event.
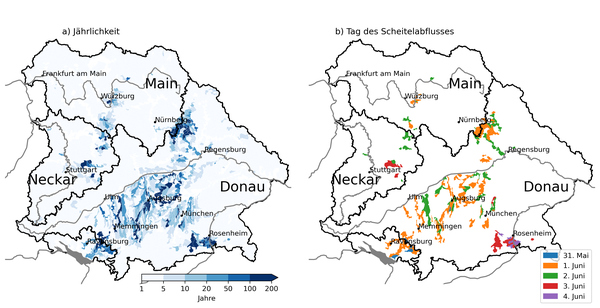
Figure 6: Simulated Peak Runoff and Timing in Small Catchments (<750 km²) — The modeled runoff response for catchments smaller than 750 km² is shown on the left figure; in the right figure the return period of the simulated peak discharge at the outlet of affected sub-catchments is displayed. The certain date when the simulated discharge peak occurred is only shown where the 20-year return level was exceeded. (Friederichs et al. 2024, Fig. 11)
Attribution and projections
What Is Climate Attribution?
Climate attribution quantifies how much more (or less) likely a given extreme event has become due to anthropogenic climate change. It often involves model simulations of same event types in two parallel worlds: one with today’s CO₂ levels and one with preindustrial levels.
Attribution analyses indicate that the probability of such an event has increased by a factor of 1.4 compared to a preindustrial climate, with an uncertainty range between 0.8 and 4.4. The event is estimated to have a 30-year return period under current climate conditions. While station data in southern Germany do not show a consistent trend in extreme precipitation statistics attributable to climate change, simulations suggest the 2024 event would have been less intense in a preindustrial climate. The elevated intensity is largely due to an increase in moderate precipitation at smaller scales. However, high-resolution climate simulations reveal no statistically significant changes in the broader spatio-temporal characteristics of heavy rainfall events between past, present, and future climates.
Final Thoughts
The two flood events of winter and May/June 2024 underscore a complex reality: climate change is subtly but significantly altering the probability and character of extreme events, sometimes also stretching them out in time or expanding them in space. The complex nature of such events, as well as their rarity by definition, requires the analysis of a very heterogeneous collection of large datasets and the use of considerable computational resources.
Infrastructure Behind the Analysis: PostAG and Freva
Freva: Flexible Evaluation System
Developed by and for the atmospheric science community, Freva is an evaluation platform that enables fast, intuitive access to a wide range of datasets and supports the reproducible application of user-defined analysis tools. Freva is hosted at DKRZ as part of ClimXtreme’s infrastructure.
The scientific evaluation of the 2023–2024 flood events was coordinated through PostAG, ClimXtreme’s dedicated Post-Event Analysis Group. Operating in two phases, it combines rapid-response diagnostics—based on standardized workflows and Freva plugins—with more in-depth modeling, including hydrological simulations, regional downscaling, and attribution studies. These analyses are carried out using both DKRZ resources and infrastructure from partner institutions.
Since the beginning of its second phase in July 2023, ClimXtreme II activities have used over 70,000 CPU node hours, 6,150 GPU hours, and around 535 Terabytes of storage, covering reference data, model runs, and analysis outputs. Some of these evaluations are managed via Freva, the Flexible Evaluation System hosted at DKRZ, which supports standardized access to climate simulations, re-analyses, and observational datasets. By early 2025, Freva had enabled more than 11,400 analysis runs from 13 institutions, powered by a growing suite of over 30 diagnostic plugins.
References:
Further information about PostAG activities: www.climxtreme.de/en/Post-AG_Event-Evaluation/article_collection/index.html
Christmas flood 2023-24:
- Grieger, J., Kunz, T., Buschow, S., Daniell, J., Lucio Eceiza, E. E., Fauer, F. S., ... & Vorogushyn, S. (2024). Dauerniederschläge und Weihnachtshochwasser im Winter 2023/24. http://dx.doi.org/10.17169/refubium-43523
- Hydro-climatological classification of DWD for christmas 2023-24
May/June flood 2024:
- Friederichs, P., Grieger, J., Kunz, T., Ulbrich, U., Bürger, G., Buschow, S., ... & Vorogushyn, S. (2024). Ergiebige Dauerniederschläge und Hochwasser in Süddeutschland im Mai und Juni 2024. http://dx.doi.org/10.17169/refubium-44009
- CEDIM report for May 2024: DOI: 10.5445/IR/1000171441
Freva portal for ClimXtreme, open for DKRZ users, and documentation.
Authors:
- Dr. Etor E. Lucio Eceiza, department: Data Analysis, German Climate Computing Center (DKRZ)
- Dr. Jens Grieger, Institute for Meteorology, Freie Universität Berlin
- Dr. Christopher Kadow, department head Data Analysis, German Climate Computing Center (DKRZ)
