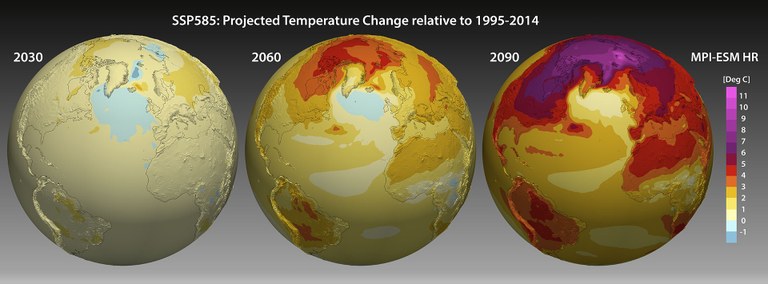
As shown for the different scenarios and models in the visualization of the simulated mean global temperature change, the strength of projected warming depends especially on the scenario selected, i.e. the resulting CO2 concentrations. Another influencing factor is the climate sensitivity (equilibrium change in annual global mean surface temperature in reaction to a doubling of the CO2 equivalent concentrations in the atmosphere) of the model selected. The spatial pattern of warming caused by additional greenhouse gases, as shown here, is very strongly influenced by physical interactions between atmosphere, ocean, land surface and the cryosphere (ice sheets, glaciers, sea ice, permafrost, ice and snow cover on land).
The video clip below shows a direct comparison of the temperature change simulated with MPI-ESM HR for the scenarios SSP126 (left-hand side) and SSP585 (right-hand side). For the optimistic scenario SSP126, warming compared to the period 1995-2014 is a bit below one degree in the global mean; accordingly, there are large bright yellow areas (less than one degree of warming) towards the end of the animation, but also – especially in high latitudes – areas showing significantly stronger warming. For the rather pessimistic scenario SSP585, the overall warming is markedly stronger; especially this scenario shows a pronounced contrast between land and oceans. Here the most intense warming (of more than 10 degrees C) occurs in the northern Polar Regions.
Video 1: comparative visualization of the change in temperature compared to 1995-2014 for the two “extreme” scenarios SSP126 and SSP585 based on the simulations with MPI-ESM HR
 Even when considering terrestrial areas only, there are large differences in the evolution of warming. By analyzing the simulated climate data one can determine, for example, the mean temperature change for individual countries. Figure 2 shows, sorted by continent, the respective mean temperature changes for the 195 states of the world for the pessimistic SSP585 scenario as simulated by MPI-ESM HR. The more intense the shade of red on the right-hand side of the color-filled areas for individual countries, the stronger would be the climate change towards the end of the century. One country in which climate would change very intensely is Canada. Relatively bright horizontal stripes, in contrast, indicate countries for which the simulation has projected a less strong change in 2m temperature. Among those are the United Kingdom and Ireland.
Such regional warming patterns tend to vary slightly from model to model. In the following three subchapters, we have compiled visualizations of the simulated temperature changes for the three different models or model configurations, respectively, which have been used for Germany’s contribution to ScenarioMIP.