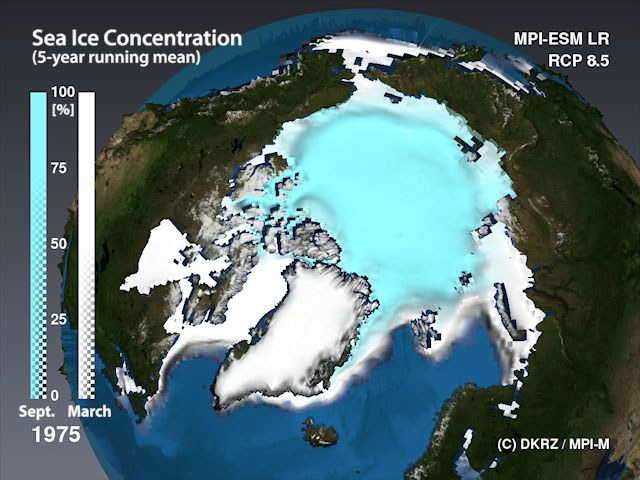
In the animation below, the development of the mean sea ice cover in the Northern Hemisphere is shown for both September (sea ice minimum) and March (sea ice maximum) for the years 1975-2300. On the left, the development for the optimistic RCP2.6 scenario is shown, and that for the pessimistic RCP8.5 scenario next to it on the right . While the RCP2.6 simulation shows that, though reduced, the arctic sea ice will remain present throughout the year, the extreme RCP8.5 experiment shows a complete disappearance in the long run. Around 2060, this situation will have exacerbated to the point where a large portion of the sea ice will have melted away during the summer, at the time of the natural sea ice minimum.
Then, in the following century, the white areas representing the winter sea ice will also diminish, leaving us with a complete disappearance of sea ice!
Images:
 |
 |
 |
| 2030 | 2060 | 2100 |
 |
 |
 |
| 2130 | 2160 | 2200 |