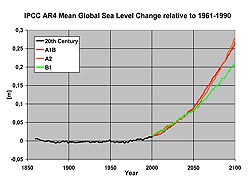
The sea surface height is affected by many different processes, acting on different time scales: short term changes due to wind or tides as well as long-term global changes due to variations of the climate and earth system. The fundamental factors for long-term changes are:
- Volume changes of ocean water as a consequence of changing temperatures (steric expansion)
- Changes of the global ocean circulation (dynamic adjustment)
- Growing or melting of the large ice sheets (Greenland, Antarctic) or mountain glaciers (eustatic change)
- Changes of the ocean basins volume due to uplift and subsidence of the earth's crust (tectonic change)
The following simulations consider steric and dynamic changes, but do not account for eustatic or tectonic effects.
Regional differences in the sea level changes
are caused by changes of the ocean circulation and the hydrologic cycle (precipitation minus evaporation). In the high southern latitudes, changes of the sea level during the 21st century are comparatively small; in the Arctic Ocean, however, the sea level rises more than twice as much relative to the global mean, due to an increasing fresh water influx from rivers and precipitation. Shifting ocean circulation patterns can also result in deviations of regional sea level changes from the global mean - e.g. in the North Atlantic.
More information about sea level rise can be found in the FAQs on the homepage of the Max Planck Institute for Meteorology.
The available animations and graphics are based on the data which were created by Felix Landerer in collaboration with the Max Planck Institute for Meteorology. He examined the relationship between regional sea level changes and climate-relevant ocean processes as a result of global climate change.


