30.01.2013
The work horse for German climate research is currently DKRZ’s IBM Power6 System “Blizzard”, which has a power consumption of about 1.15 MW. Additionally, 150 kW are needed for the hard disk systems and IT Infrastructure. Furthermore, 250 kW are necessary for the cooling system if the outside temperatures exceed 4°C. DKRZ’s total power consumption lies at about 2 MW, with a yearly power consumption of over 17 GWh.
An important step in December 2011 was the installation of a cold aisle containment, that prevents the recirculation of hot air emitted by the cabinets. Furthermore, the interaction of the cooling water circuit and chillers was adjusted, as it was previously not optimally set for the computer system's specific operations.
Due to these measures, about 750 MWh, or 425 t CO2 are saved per year, lowering costs by nearly 100,000 Euros. This project was promoted by the climate protection concept of the City of Hamburg 2007-2012, whose goal it was to reduce CO2 Emissions by 20% by 2012 as compared to 1990.
Measures
The most important activities in this project included the regulation of airflow in the data center as well as the optimization of the cold water circuits during chiller operations.
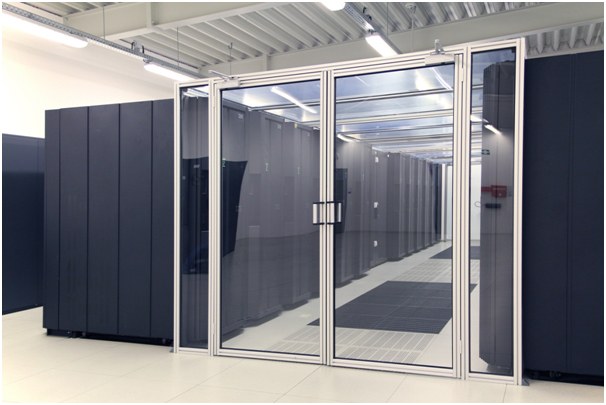
The first step was the installation of containments for the previously uncontained rack rows in the computer rooms. With these containments, a physical separation between the "cold" and "hot aisles" could be realized. Cold air is transported from the cooling system under the raised floor to the "cold aisles", where it is absorbed by the IT equipment. The warm air flows back into the "hot aisles" on the backside of the racks.
Before installing these containments, floor elements equipped with fans were required to provide sufficient cold air even for the computers in the upper parts of the racks. However, with open rack rows, the cold air blown in was mixed with the warm air in the room, particularly on the ends and tops of the rack rows. Therefore, it was essential to supply significantly more cold air than necessary to make sure that the computing components were properly cooled, which also partly resulted in a cooling of the entire computing hall.
With the containments (Figure 1), the cold aisle is physically separated from the warm aisle by a coverage on top of the racks and by the doors, which keeps the cold air from mixing with the warm air in the room. Concurrently, temperature sensors were attached to the roofs of the containments in order to control the cooling units which cool the air and transport it into the raised floor using a certain amount of pressure. This way, it can be assured that an optimal amount of cold air is available in the cold aisle to keep even the tops of the racks cooled.

 Figures 2 and 3 show heat images of computer racks before and after the installation of the containment. They show how the previously warmer rack areas at the ends and tops are now more evenly and efficiently cooled. Particularly the “Hot Spots” in the top left area of the first rack are now significantly cooler.
 The second step consisted of the optimization of the cooling and cold water circuits in combination with the chillers. The cooling system for the data center was planned during the reconstruction of the building, without prior knowledge of which supercomputer would be acquired. Several parameters of the cooling system could only be optimized after the installation of the computer systems. Further analysis brought up several non-optimal settings which could be optimized.
Previously, the cooling machines operated at a fixed temperature of 30°C. However, it turned out that the cooling machines could also operate at lower temperatures and therefore use less electricity. For the best case scenario of 19°C, the cooling system uses about 100 kW less electrical power than at 30°C while consuming less energy.
A part of the saved energy is however compensated by the heat exchangers on the roof, which need more electrical power in order to cool down the water to 19°C. This energy saving mechanism works only for outdoor temperatures up to 13°. Warmer temperatures cause the cooling water temperature to rise and the amount of energy saved with the cooling machines to decline.
It was also found out, that the pumps that power the cooling water circuit are capable of operating under less pressure (and less energy consumption) without compromising the cooling mechanism. Lower pressure causes greater temperature differences between inlet and outlet.
Estimate of savings
The savings and CO2 reductions achieved by the energy conservation methods depend on multiple factors:
- Compared to last year, several new servers were installed which cause higher energy consumption and produce more waste heat, which in turn needs more cooling power.
- The energy savings are largely dependent upon outside temperatures not only throughout the day, but also during the seasons.
- Depending on its workload, the supercomputer’s power consumption may vary by up to 100 kW (in certain cases), causing fluctuations in cooling power.
- Various readjustments were made gradually over several days and weeks.
- The power consumption of several components affected by the readjustments cannot be directly determined due to the lack of measuring points.
- Several optimizations, such as the lowering of cooling water temperature, tend to cause an increase in power consumption in other areas, which is often difficult to measure.
Due to these factors, it is not possible to make a direct comparison between energy consumption before and after the savings measures. In order to estimate the amount saved, one can observe the computing center’s PUE (Power Usage Effectiveness) before and after the implementation of these measures. The PUE works as a quotient of the entire energy consumption of the computing center (IT and cooling) divided by the power consumption available by the IT facilities. In doing this, the efficiency of the IT’s operations can be measured: the lower the PUE, the higher the cooling efficiency.
The DKRZ’s PUE is continually measured by the building’s control system, with measurements having been recorded since June 10th, 2010. This data is broken down by outside temperature so that temperature dependence can be determined. Figure 4 shows the outcome of the PUE evaluations for all recorded data in 2010, the entire year 2011, as well as data from June 14th, 2012 until today. The adjustments in cooling were mostly carried out between January 1st and June 14th, 2012. This period of time has been left out of the graph.

The presented PUE only takes into account the time during which the cooling machines were in use; by outside temperatures less than 7°C, the facility was partly operated by free cooling, meaning without cooling machines. Due to the change-over technology between free cooling and operating under cooling machines, there is an overlap at times where the temperature is between 1°C and 7°C. In order to obtain comparable numbers, the figure only takes into account the times the cooling machine was in operation.
Since the average power consumption of several computing components added up to 1490kW in 2012, a difference of 0.01 in the PUE shows an energy conservation of about 14.9kW. Due to the measures, an energy saving of over 120 kW can be reached at temperatures below 12°C.
The amount saved depends heavily upon outside temperatures so that savings can only be determined retroactively. On the basis of the observed average temperatures for Hamburg from 2000 to 2011, about 750 MWh can be saved per year with the implementation of the conservation measures. The Federal Environmental Agency in 2011 estimated this to be a conservation of approximately 425 t CO2.
With the analysis of the consumption data in regards to the gradual technological changes, an energy conservation of about 475 MWh, or 270 t CO2 was achieved for the year 2012.