Preliminary analyses show, that global circulation systems like the North Atlantic Oscillation or the Indian Monsoon can be simulated realistically. Regional weather phenomena are often better reproduced than in global reanalysis data, which mostly feature low spatial resolutions and only 6-hourly data. Considering the high resolution, this global data set may provide an alternative to regional climate simulations, and may be used to study global climate relationships.
Animation: Visualization of the development of hurricane "Wilma". On the left, the high-reolution climate reconstruction using ECHAM6 T255 is shown, while the NCEP1 reanalysis on the right uses a much coarser grid. The colors represent the wind speed; the black lines are lines of constant sea level pressure (isobars).
Storms generally pose a threat to the population, its living environment and economy. Besides the vulnerability of buildings and infrastructure, this applies in particular to several industrial sectors like agriculture, forestry or offshore industries. Extratropical and tropical cyclones (typhoons or hurricanes) and small-scale storms like polar lows or medicanes are characterized by high wind speeds, often in combination with large precipitation rates, and may lead to extreme events like storm surges and flooding. Therefore it is important to analyze the storm activity in the previous decades in order to assess future changes in storm activity. Important questions are if there were changes in storm numbers, intensity, position and shape of their tracks, or which region they affected in particular.
This can only be achieved with thorough knowledge of wind conditions of the past. In order to derive reliable statistics, very long time series of storm variables are needed for at least several decades. Over time, many measurement methods changed, for instance due to measurement station relocations or the introduction of satellite data at the end of the 1970s. Reanalysis data include many weather measurements like station, ship, airplane, buoy, or satellite data. For the whole reanalysis time period, measurements are fed into a non-changing atmospheric model and are then homogenized as effectively as possible. This way, a relatively homogeneous data set for the past decades is produced, though it is mostly available on coarse grids and on a 6-hourly basis only.
A new approach was recently presented in the project ‘Global high-resolution climate reconstruction’ of the excellence cluster ‘Integrated Climate System Analysis and Prediction’ (CliSAP). This project was conceptually initialized in 2011 by Hans von Storch. A global weather data set for the past 67 years from 1948 to 2015 was computed with the atmospheric climate model ECHAM6. The modelled weather was adjusted towards NCEP-NCAR 1 (hereafter referred to as NCEP) reanalysis data, but just for very large spatial scales like, for instance, high and low pressure systems, and only for the variables vorticity and divergence, which describe the wind flow. The adaptation was done with the so-called spectral nudging technique (von Storch et al., 2000), which adds a term to the model solution which reduces the difference to the reanalysis data for large spatial scales. Spectral nudging was applied in a height-dependent way and as the most suitable height profile a plateau profile with largest values for medium and higher model layers was determined. Regional weather phenomena though, which prevail in lower atmospheric layers, are simulated by the climate model without nudging. The global model has a high resolution featuring a grid distance of about 50 km and 95 vertical layers (T255L95) and can simulate regional details, which cannot be resolved by the forcing reanalysis due to its coarse grid. The simulated circulation systems like the North Atlantic Oscillation or the Indian Monsoon agree with reanalyses.

Fig. 1: Temporal evolution of the NAO Index (Winter) for NCEP1 reanalysis data (blue), the global climate model ECHAM6 (red), and CRU data as a reference (grey) for 1948/1949 to 1972/1973 (left side) and 1976/1977 to 2000/2001 (right side). But instead of the ECHAM6 simulation with spectral nudging, the right side shows an ECHAM6 simulation with the same settings, but without nudging (AMIP2).
Figure 1 shows the temporal evolution of the North Atlantic Oscillation index (normalized pressure difference at mean sea level between Iceland and the Azores) for winter in NCEP1 reanalysis data, the global climate run ECHAM6, and as a reference the gridded observational data set of the climate research unit (CRU) for two different time periods. A good agreement between the reanalysis and the ECHAM6 simulation with spectral nudging is apparent. A simulation without spectral nudging (right side, AMIP2), though, reveals larger differences, both in comparison with the reanalysis and to observations.
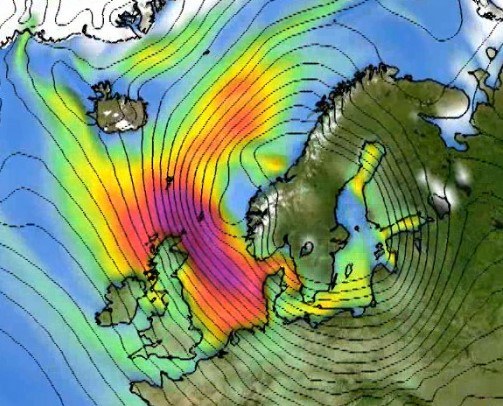
Regional weather phenomena like tropical cyclones (Fig. 2) or intense low pressure systems (Fig. 3) or often depicted more realistically by the global model, even though their intensity is still underestimated in comparison with observations. This new global data set allows for the analysis of changes in different kinds of extreme events that occurred over the last decades. Currently the data are being used to examine tropical cyclones that transition into extratropical low pressure systems of the mid-latitudes (Feser et al., 2015). Some of these former hurricanes reach Europe as intense extratropical storms, where they may lead to large damages.

Fig. 2: Typhoon Haiyan on November 10, 2013, close to the coast of Vietnam and the island of Hainan in the new global ECHAM6 data set (left) and in NCEP1 reanalysis data (right): Lines of constant air pressure (isolines) and near-surface wind field (colors).

Fig. 3: The storm surge that hit the city of Hamburg in 1962 in the new global ECHAM6 data set (left) and in NCEP1 reanalysis data (right): Lines of constant air pressure (isolines) and near-surface wind field (colors) for February 16, 1962.
This extensive and highly resolved weather simulation for about 67 years (Schubert-Frisius et al., 2016) was computed using the high performance computing system for Earth system research of the German Climate Computing Center. The climate simulation took a computation time of nearly 8 months and used about 2 million CPU hours and 150 Terabyte of disk space for the hourly weather data archival storage of more than 200 meteorological variables. Recently, DKRZ quality checked the consistency of the climate simulation data, added it to its CERA data base and published it: doi:10.1594/WDCC/CLISAP_MPI-ESM-XR_t255l95.
For scientific studies, the data is available here:
http://cera-www.dkrz.de/WDCC/ui/Compact.jsp?acronym=CLISAP_MPI-ESM-XR_t255l95
More information on the data is also available at the Integrated Climate Data Center - ICDC:
http://icdc.zmaw.de/daten/1/atmosphere/echam6-climate-reconstruction.html
Authors:
Frauke Feser, Helmholtz-Zentrum Geesthacht
Martina Schubert-Frisius, Helmholtz-Zentrum Geesthacht
Contact:
Martina Schubert-Frisius: martina.schubert-frisus[at]hzg.de
References:
Schubert-Frisius, M., F. Feser, H. von Storch, S. Rast, 2016: Spectral Nudging Sensitivity Study using an AGCM. Mon. Wea. Rev., under review.
Feser, F., M. Barcikowska, S. Haeseler, C. Lefebvre, M. Schubert-Frisius., M. Stendel, H. von Storch and Matthias Zahn, 2015: Hurricane Gonzalo and its extratropical transition to a strong European storm. [in "Explaining Extreme Events of 2014 from a Climate Perspective"]. Bull. Amer. Meteor. Soc., 96(12), S51-S55.
von Storch, H., H. Langenberg, and F. Feser, 2000: A Spectral Nudging Technique for Dynamical Downscaling Purposes. Mon. Wea. Rev. 128(10) 3664-3673.