 Air traffic emits a number of species. Besides carbon dioxide, non-CO2 emissions, like nitrogen oxides, water vapour, carbon monoxide, unburned hydrocarbons, and soot play an important role and lead to changes in the composition of the atmosphere (Lee et al., 2010). They are contributing significantly to climate change through changes in the greenhouse gas concentrations of carbon dioxide (CO2), ozone (O3), water vapour (H2O), and methane (CH4) and through the formation of contrail-cirrus. The impact of a locally confined air traffic emission shows a large spatial and temporal variability, except for carbon dioxide, because of its long perturbation lifetime. The project REACT4C investigated trans-Atlantic air traffic and analysed, which routing changes were required to achieve a reduction in the air traffic's contribution to climate change by combining a detailed climate-chemistry model (EMAC) and a detailed air traffic model (SAAM). Typical weather situations in the North Atlantic for winter and for summer were selected (Irvine et al., 2013). The most prominent weather situation was characterized by a strong jet stream.
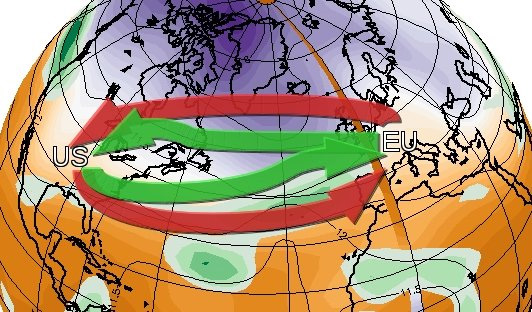
Figure 1: Sketch of the air traffic flow pattern for the economically optimized air traffic (red arrows) and climate optimal air traffic (green arrows).
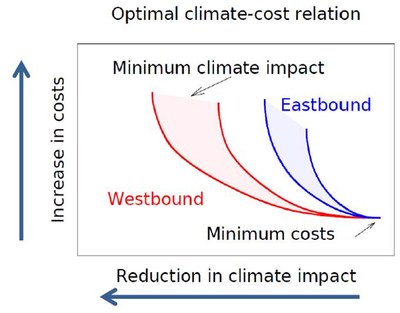
The results show that for this weather situation a horizontal rerouting (Figure 1, green arrows) avoids regions where non-CO2 emissions from air traffic lead to large climate impacts. With only small changes to the air traffic routings and flight altitudes, climate impact reductions of around 25% can be achieved by only small changes in economic costs of less than 0.5% (Figure 2). Maximal climate impact reductions (60%, westbound) can be achieved at much higher costs (15%).
Figure 2: Relation between climate impact reduction and cost increase due to climate-optimized routing. Red areas show westbound flights, blue areas mark eastbound flights. In the lower right, the minimal cost air traffic solution is shown.
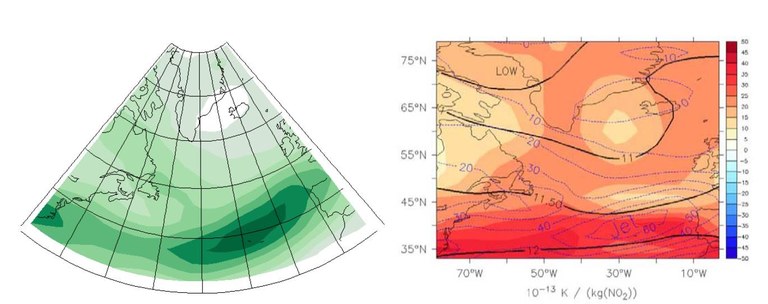
Clear differences were found for westbound and eastbound air traffic, which result from the specific weather situation (Figure 3, left), which is characterized by a very west-eastward directed wind. Hence eastbound flights take advantage of the tail winds from the jet stream and routings, which leave the jet stream, and avoid larger climate impacts from non-CO2 effects (Figure 3, right) have a large fuel penalty. This reduces the potential for climate impact reduction for eastbound flights in this specific weather situation. As an example of these non-CO2 effects the climate impact of a local NOx emission is shown in Figure 3 (right). NOx produces ozone, which is a greenhouse gas and leads to an increase in global warming. Red areas mark regions, where a NOx emission leads to a large climate impact. This region coincides with the area of the jet stream. So avoiding the jet stream also reduces the climate impact from NOx emissions, but – in the case of eastbound flights – strongly enhances CO2 emissions since the fuel consumption is increased to cope with the smaller tail winds.
A key part of the project was to calculate these maps of the climate impact of a localized emission – so-called climate cost functions. These calculations require intensive supercomputing and were carried out on the supercomputer Blizzard at DKRZ. About two million CPU-h were used for testing and for the final simulations.
Figure 3: Left: Wind speed at cruise altitude (m/s, contours between 20 and 60 m/s). Right: Climate-cost-function of NOx via ozone formation in 10-13 K/kg (NO2). The geopotential height is overlaid in black and the wind speed in blue.
Around 800 flights (Figure 4) crossed the Atlantic at that day - 400 in either direction. On the basis of the climate-cost functions for the emissions of carbon dioxide, nitrogen oxides and water vapour, as well as for the formation of contrails, Eurocontrol optimized the air traffic with regard to operational costs (Figure 1, red arrows) and climate impact (Figure 1, green arrows).
Figure 4: Air traffic routes for the trans-Atlantic air traffic.
The changes in air traffic routing affect not only the geographic location of the route but also the flight altitude. In the situation where the flights are organized in an economic best way (Figure 2, lower right), most flights are at flight levels 380 (Figure 5, red shaded area). This remains the case for the first 25% of the maximal climate reduction (red line). Only when large climate reductions are achieved the flight altitude is reduced. In the maximum climate impact reduction (Figure 2, upper left), most flights occur at flight level 300 (Figure 5, green area).
Figure 5: Change of the probability density function of air traffic characteristics along the
Cost-benefit line for westbound air traffic (see Fig. 2, red).
REACT4C project partners:
- DLR, Institut für Physik der Atmosphäre, Germany
- Department of Meteorology, University of Reading, England
- CICERO, Oslo, Norway
- EUROCONTROL, Bruxelles, Belgium
Award:
The study was awarded with the ‘Aviation Award 2014’. Further information (in German): here.
Autors (Contakt):
Sabine.Brinkop, DLR: Sabine.Brinkop[at]dlr.de
Volker Grewe, DLR: Volker.Grewe[at]dlr.de
Literature on REACT4C:
-
Grewe, V., Frömming, C., Matthes, S., Brinkop, S., Ponater, M., Dietmüller, S., Jöckel, P., Garny, H., Dahlmann, K., Tsati, E., Søvde, O. A., Fuglestvedt, J., Berntsen, T. K., Shine, K. P., Irvine, E. A., Champougny, T., and Hullah, P.: Aircraft routing with minimal climate impact: The REACT4C climate cost function modelling approach (V1.0), Geosci. Model Dev. 7, 175-201, DOI: http://dx.doi.org/10.5194/gmd-7-175-2014, 2014.
-
Grewe, V., Champougny, T., Matthes, S., Frömming, C., Brinkop, S., Søvde, A.O., Irvine,E.A., Halscheidt, L., Reduction of the air traffic's contribution to climate change: A REACT4C case study, http://dx.doi.org/10.1016/j.atmosenv.2014.05.059, Atmos. Environm. 94, 616-625, 2014c.
-
Irvine, E. A., Hoskins, B. J., Shine, K. P., Lunnon, R. W. and Froemming, C.: Characterising North Atlantic weather patterns for climate-optimal aircraft routing. Meteorological Applications, 20 (1). pp. 80-93. ISSN 1469-8080 DOI: http://dx.doi.org/10.1002/met.1291, 2013.
-
Matthes, S., Schumann, U., Grewe, V., Frömming, C., Dahlmann, K., Koch, A., Mannstein, H., Climate Optimized Air Transport, 727-746, Ed. U. Schumann, ISBN 978-3-642-30182-7, ISBN 978-3-642-30183-4 (eBook), DOI: http://dx.doi.org/10.1007/978-3-642-30183-4, Springer Heidelberg New York Dordrecht London, 2012.
References:
-
Lee, D.S., Pitari ,G., Grewe, V., Gierens, K., Penner, J.E., Petzold, A., Prather, M.J., Schumann, U., Bais, A., Berntsen, T., Iachetti, D., Lim, L.L., Sausen, R., Transport impacts on atmosphere and climate: Aviation, Atmos. Environm. 44, 4678-4734, 2010.


