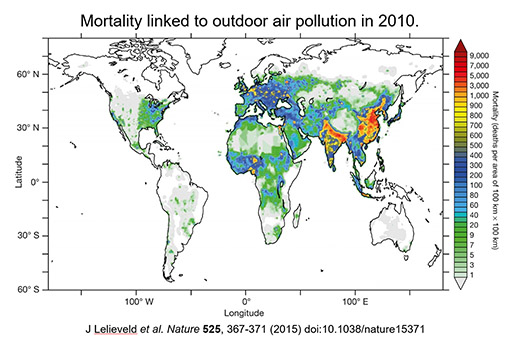
Exposure to air pollution is particularly acute in Asia, especially in China and India, where three-quarters of the world’s pollution-related deaths occur. It has been calculated (Lelieveld et al., 2015) that 3.3 million people worldwide, 1.4 million people in China and 650,000 people in India die every year as a consequence of air pollution (see figure 1). In the EU, exposure to fine particles and ozone claims 180,000 lives a year, including 35,000 in Germany. In many countries, air pollution accounts for roughly ten-times more deaths than road accidents.

Fig.1: Mortality linked to outdoor air pollution in 2010. Units of mortality, deaths per area of 100km x 100km (color coded). In the white areas, annual mean particulate matter (PM2.5) and ozone (O3) values are below the concentration–response thresholds where no effect of pollution on human health is expected (from Nature, Lelieveld et al., 2015)
In the project, the numerical model EMAC (ECHAM5/MESSy Atmospheric Chemistry, Joeckel et al. (2012)) is used to investigate how mortality rates are affected by air pollution, also considering various emission sources, such as industry, transport, agriculture, fossil fuel-fired power plants, as well as domestic energy use. The latter category includes diesel generators, small stoves and smoky open wood fires, which many people in Asia use for heating and cooking. Furthermore, the mortality rates are calculated in individual countries together with the proportion of deaths due to various causes, which can support policy making. The numerical model is used to estimate (and predict, see also this visualization in our media center) the concentration of pollutants in the atmosphere. Afterwards, the values are used in conjunction with epidemiological studies to link air pollution to “premature mortality”.
The usage of a global atmospheric chemistry model is necessary to calculate the concentrations of air pollutants and to provide data for locations that are not monitored by air quality measurements. Additionally, the global model can be used to estimate possible future scenarios (see below) based on our present knowledge. Nevertheless, the computation of such a complex model is extremely expensive. The EMAC model includes not only calculations of the dynamics and the consequent tracer transport (via the core model ECHAM5), but also the calculation of chemical photo-oxidation of tracers as well as different removal terms such as wet and dry deposition of pollutants (via the MESSy submodels). The use of DKRZ’s supercomputer is therefore essential for the success of the project. Around one million CPU hours were already used on the former supercomputer “Blizzard” for the calculations described by Lelieveld et al. (2015) and further one to two million CPU hours of “Mistral” will be needed on the new machine to show how a possible deterioration of air quality on our planet can be avoided.
In fact, according to the studies of Pozzer et al. (2012), see figure 2, and Lelieveld et al. (2015), the mortality rate caused by air pollution will drastically increase in the future in a “business as usual” scenario. Lelieveld et al. (2015) estimated that, if emissions continue to rise at current rates and are not curbed by new legislation, the pollution-related mortality in South Asia and East Asia will double by 2050. The number of smog-induced deaths worldwide could rise to 6.6 million per year worldwide, doubling the current value. Pollution-related mortality in Europe and the USA are also likely to increase moderately, especially in big cities. However, these negative scenarios can be avoided by implementing additional legislation. As shown by Giannadaki et al. (2015), the implementation of stringent legislation such as the one in the USA could reduce mortality in East Asia up to 69%.

Fig. 2: Changes of multi-pollutant air quality index between 2005 and 2050 for different countries (30 countries with the strongest changes) for a business as usual scenario (from Pozzer et al., 2012). The higher the increase, the lower the air quality is projected to be by the year 2050 with respect to the actual levels. The red dashed line depicts the global change between 2005 and 2050.
It is therefore essential to estimate if the legislation applied in Europe over the last 20 years was really efficient in reducing pollution and increasing air-quality. In this sense, the use of newly developed emissions scenarios from the JRC (Joint Research Centre, European Commission) will help to estimate which impacts new technology and changes in energy usage have on air quality in Europe and worldwide.
Author:
Andrea Pozzer, YW5kcmVhLnBvenplckBtcGljLmRl
Contact:
- Andrea Pozzer, Scientific Contact, YW5kcmVhLnBvenplckBtcGljLmRl
- Susanne Benner, Head of Communication, Max Planck Institute for Chemistry, c3VzYW5uZS5iZW5uZXJAbXBpYy5kZQ==
References:
Giannadaki, D., Lelieveld, J. and Pozzer, A. : “Implementing the US air quality tandard for PM2.5 worldwide can prevent millions of premature deaths per year”, Environmental Health,15:88, doi:10.1186/s12940-016-0170-8, 2016.
Jöckel, P., Kerkweg, A., Pozzer, A., Sander, R., Tost, H., Riede, H., Baumgaertner, A., Gromov, S., and Kern, B.: “Development cycle 2 of the Modular Earth Submodel System (MESSy2)”, Geosci. Model Dev., 3, 717-752, doi:10.5194/gmd-3-717-2010, 2010.
Lelieveld, J., Evans, J.S., Fnais, M., Giannadaki, D., and Pozzer, A. : “The contribution of outdoor air pollution sources to premature mortality on a global scale”, Nature, 525, 367-371, doi:10.1038/nature15371, 2015.
Pozzer, A., Zimmermann, P., Doering, U.M., van Aardenne, J., Tost, H., Dentener, F., Janssens-Maenhout, G., and Lelieveld, J.: “Effects of business-as-usual anthropogenic emissions on air quality”, Atmos. Chem. Phys., 12, 6915-6937, doi:10.5194/acp-12-6915-2012, 2012.
