Climate simulations for the model intercomparison project CMIP6 and the sixth world climate report
The Intergovernmental Panel on Climate Change IPCC periodically summarizes the current state of knowledge of climate research throughout the world in its reports. Each of these reports consists of several parts and comprises thousands of pages. The first part of the sixth assessment report AR6 covering the scientific basis of climate change is due for adoption and publication in summer of 2021. The remaining parts will likely be published in the second half of this year or early in 2022.

For AR6, the World Climate Research Programme (WCRP) initiated the comprehensive model intercomparison project CMIP6, which comprises extensive coordinated simulations with coupled earth system- and climate models.
Approximately 31 institutions worldwide, with some of them using several different models or model configurations, have contributed to ScenarioMIP, a sub-project of CMIP6 encompassing a range of socio-economic developments. Depending on the scenario, up to 49 different models were used. The variety of models helps to map both the uncertainties in the understanding of the climate system and the different possibilities of representing climate processes in such models. The models are consistent in their main results and illustrate the serious changes that could occur due to human-induced climate change.
Germany’s contribution to CMIP6 has been funded by the German Federal Ministry of Education and Research (BMBF). DKRZ is involved in running CMIP6 simulations, as well as in storing and processing the data and in providing CMIP6 output to the scientific community. A large portion of the simulations constituting the German contribution to this international project has been performed on DKRZ’s supercomputer Mistral.
Entry point to the DKRZ website on CMIP6 simulations: www.dkrz.de/communication/climate-simulations/cmip6-en/cmip6
(A) Overview of CMIP6 activities at DKRZ: www.dkrz.de/communication/climate-simulations/cmip6-en/cmip6-acivities-at-dkrz-overview
Compute time and output data
Over the past years, scientists of the Max Planck Institute for Meteorology (MPI-M), the Alfred Wegener Institute, Helmholtz Center for Polar and Marine Research (AWI), the German Aerospace Center (DLR), the German Meteorological Service (DWD) and DKRZ have conducted a multitude of CMIP6 experiments. They have standardized and published the output data via the ESGF (Earth System Grid Federation) data node at DKRZ. In the year 2019 alone, those simulations consumed about 1.2 million node hours of compute time at DKRZ. A total of 13,000 model years has been simulated within this scope. By the end of April 2020, the CMIP6 data pool at DKRZ contained approximately 1.1 petabytes of quality-checked, published primary data. Another 2.1 petabytes were comprised of replicated climate model data, i.e. copies of simulation results provided by institutes in other countries. The CMIP6 data used for the IPCC AR6 is being transferred to the IPCC-AR6 reference data archive of the IPCC Data Distribution Centre (DDC) at DKRZ in order to ensure long-term reusability (e.g. by climate impact- and adaptation researchers).
Models and scenarios
 For the CMIP6 scenario simulations contributing to AR6, which were performed at DKRZ, two configurations of the earth system model MPI-ESM-1.2 developed by MPI-M and the climate model AWI-CM-1-1 developed by AWI (figure 1) were used. The two configurations of MPI-ESM-1.2 differ in resolution.
Figure 1: Horizontal resolution of the Ocean-seaice model grid for the CMIP6 simulations with the model AWI-CM.
With regard to AR6, a new set of so-called SSP climate scenarios (Shared Socioeconomic Pathways) was developed, which assume different socio-economic developments and different evolutions of the atmospheric greenhouse gas content. SSP1 describes an increasingly sustainable world, while SSP2 extrapolates the past and current trend into the future along with rising income inequalities. SSP3 describes regional rivalry, and SSP4 inequality with a widening chasm between globally cooperating developed societies and developing countries. SSP5 represents a development based on fossil fuels and an energy-intensive lifestyle. A more detailed description of the scenarios used and graphics illustrating the respective future pathways of carbon dioxide (CO2) concentrations and –emissions are also available on the DKRZ website.
(B) Further information on the models used: www.dkrz.de/communication/climate-simulations/cmip6-en/the-model
(C) Further information on the SSP climate scenarios: www.dkrz.de/communication/climate-simulations/cmip6-en/the-ssp-scenarios
Results
Numerous visualizations show possible future developments of the most important climate parameters for the different scenarios. They are based on results of climate simulations that were run with the three German models.
Graphs of the global mean near-surface air temperature illustrate possible temporal evolutions of climate change for different pathways of socio-economic development (figure 2) as an introduction to and overview of the model simulations. A comparison of the observed (yellow line) and the simulated past (gray lines) yields a good agreement regarding the amount and course of warming up to now. All models show that in the best case (scenario SSP126, green lines), warming by the end of the century may stay below two degrees relative to the preindustrial mean. For the pessimistic scenario SSP585 (purple lines), however, a strong warming of 3.5 to 4 degrees relative to “today” (1995-2014) is being projected. The respective range of temperature developments for a scenario is a measure of the uncertainty. The model uncertainty that becomes apparent by comparing different models is larger than the simulated internal climate variability of individual models. It is assumed that continuing research will be able to further reduce model uncertainty. The uncertainty due to internal variability can be determined more exactly, though not reduced, with a higher number of realizations, as was done for the simulation of the historical past and scenario SSP370.

Figure 2: Overview of the simulated development of the global mean near-surface temperature. In the second half of the 21st century, the temperature graphs for the scenarios differ considerably; they project a range of warming of approximately one to four degrees for the year 2100 (relative to the reference period 1995-2014).
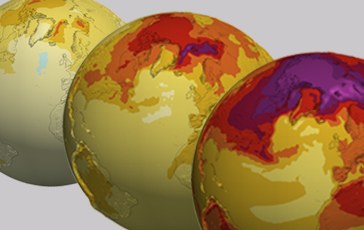
Animated visualizations of the change in the surface air temperature illustrate the regional developments projected for the different scenarios. All scenarios show a clear contrast between the warming over the oceans and over land surfaces. As the deep ocean can take up large amounts of heat and thereby has a damping effect, the ocean water warms far more slowly and less strongly than the land surface. The largest temperature changes occur in areas with changing sea ice cover or with changing snow cover on land.

Figure 3: Change in 2m temperature for the rather pessimistic scenario SSP585 as simulated by the model MPI-ESM HR. The three globes show the warming pattern (annual mean) for the years 2030, 2060 und 2090 compared to the “current” situation (1995-2014).
With rising air temperatures, the water cycle intensifies and global mean precipitation increases by a couple of percent, depending on the selected scenario. Visualizations of the change in precipitation, however, show a redistribution at the same time: some areas may receive more precipitation in the future while others may receive considerably less; moreover, the strength of this redistribution varies with the seasons.
(D) Further information on the results: www.dkrz.de/communication/climate-simulations/cmip6-en/results
Data access and the CMIP6 Data Pool
The CMIP Data Pool contains often-needed flagship collections of climate model data, is hosted as part of the DKRZ data infrastructure and supports scientists in high volume climate data collection, access and processing. The citation service for CMIP6, also hosted at DKRZ, ensures that all CMIP6 data are citable and that data users can give credit to the institutions for data provision. Moreover, DKRZ supports the IPCC by providing the CMIP Data Pool and the DKRZ infrastructure within the scope of the DDC support activities.
(E) Further information on access to CMIP6 data: https://cmip-data-pool.dkrz.de
Publications:
- Eyring et al. (2016): Overview of the CMIP6 experimental design and organization. https://doi.org/10.5194/gmd-9-1937-2016
- The CMIP6 landscape (2019): https://doi.org/10.1038/s41558-019-0599-1
- Righi et al. (2020): ESMValTool v2.0 – Technical overview, https://doi.org/10.5194/gmd-2019-226
- Bock et al. (2020): Quantifying progress across different CMIP phases with the ESMValTool., J. Geophys. Res. Atmos., https://doi.org/10.1029/2019JD032321
- Mauritsen et al. (2019): Developments in the MPI-M Earth System Model version 1.2 and its response to increasing CO2, https://doi.org/10.1029/2018MS001400
- Müller, W. A., Jungclaus, J.H., Mauritsen, T., Baehr, J., Bittner, M., Budich, R., et al., 2018: A higher-resolution version of the Max Planck Institute Earth System Model (MPI-ESM1.2-HR). Journal of Advances in Modeling Earth Systems, 10, 1383–1413, https://doi.org/10.1029/2017MS001217.
- Stockhause et al. (2019): Data Distribution Centre Support for the IPCC Sixth Assessment, https://doi.org/10.5334/dsj-2019-020
- Semmler et al. (2020): Simulations for CMIP6 with the AWI climate model AWI-CM-1-1, Journal of Advances in Modeling Earth Systems, 12, e2019MS002009. https://doi.org/10.1029/2019MS002009
Authors:
Michael Böttinger, DKRZ (e-mail: Ym9ldHRpbmdlckBka3J6LmRl, phone: +49 40 460094 344)
Jana Meyer, DKRZ (e-mail: amFuYS5tZXllckBka3J6LmRl, phone: +49 40 460094 332)
Scientific contact:
Dr. Tido Semmler, Alfred-Wegener-Institut, Helmholtz-Zentrum für Polar- und Meeresforschung, Bremerhaven (e-mail: VGlkby5TZW1tbGVyQGF3aS5kZQ==, phone: +49 471 4831 2287)
Dr. Johann Jungclaus, Max Planck Institute for Meteorology, Hamburg (e-mail: am9oYW5uLmp1bmdjbGF1c0BtcGltZXQubXBnLmRl, phone: +49 40 41173 109)