04.11.2019
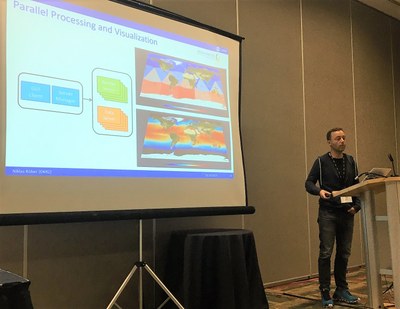
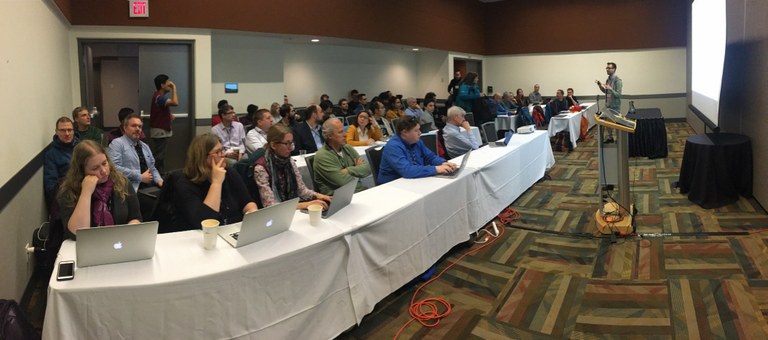
 In several short presentations, the needs of various application groups as well as application-oriented solutions were presented and discussed. After an introduction Marc Rautenhaus showed typical visualization tools being used in the weather forecast, Phil Austin (UBC) reported on analyzes of cloud simulations, Tobias Günther (ETH Zurich) showed work on 3D visualization of local wind phenomena, John Clyne (NCAR) reported on "Progressive rendering of large atmospheric data sets" and Niklas Röber (DKRZ) presented his work on in-situ visualization in climate research. At the end, about 50 participants had time for further discussion.
The IEEE Visualization (VIS) conference was held October 20-25 in Vancouver, Canada and is the world's largest and most important conference on visualization and computer graphics. The conference focuses on three subtopics: IEEE Visual Analytics Science and Technology (VAST), IEEE Information Visualization (InfoVis) and IEEE Scientific Visualization (SciVis).

Further information about the conference: http://ieeevis.org/year/2019/welcome
