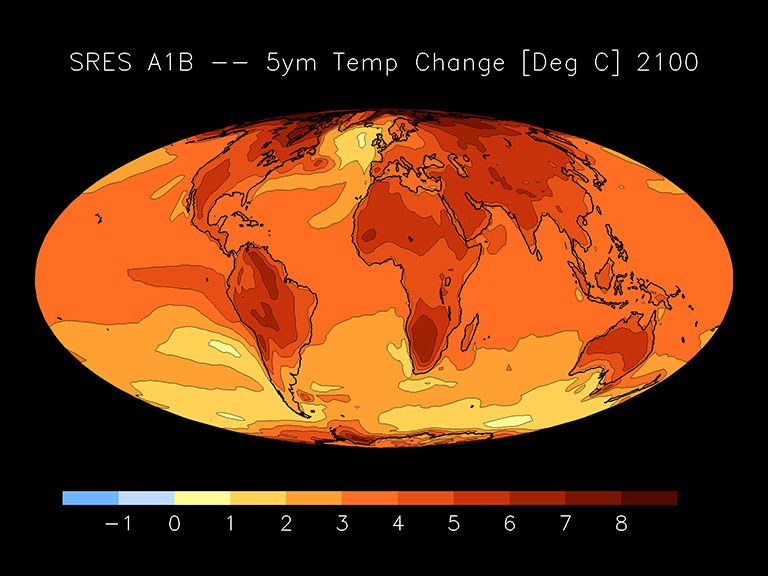
The different assumptions for emissions of greenhouse gases and aerosols according to the different scenarios result in different projected changes of the 2-meter temperature. The warming varies regionally. The warming over the continents is, for example, much stronger compared to the temperature increase over the oceans. Though this typical warming pattern appears within a few decades, with different strengths for the different scenarios. Consequently, the warming over land is much stronger compared to the global mean temperature increase.
")
Animations (MPEG-1, for download)
These animations show the 5-year running mean of the "ensemble mean" for the IPCC SRES scenarios A2, A1B and B1.
|
|
Animation: Simulated temperature change relative to the mean temperature between 1961-1990 for scenarios A2 and B1. The period projected here is the time from 1980 to 2100. (Mpeg1, 4 MB) |
 |
Animation: Simulated temperature change relative to the 1961-1990 mean for scenario A2. (Mpeg1, 3 MB) |
 |
Animation: Simulated temperature change relative to the 1961-1990 mean for scenario A1B. (Mpeg1, 3 MB) |
 |
Animation: Simulated temperature change relative to the 1961-1990 mean for scenario B1. (Mpeg1, 3 MB) |
