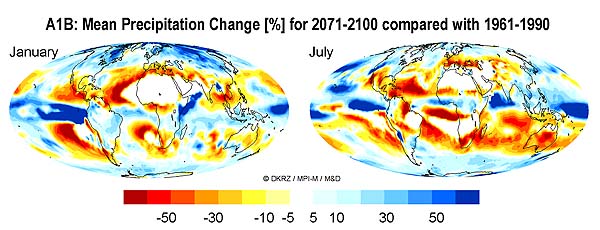
Due to climate change, the cycle of precipitation and evaporation is going to be intensified. Within the next hundred years, the global mean precipitation might increase by several percent. For scenario A1B for example, our simulations show an increase of approximately 7 percent by 2100. However, the spatial and temporal distribution of the rainfall will also change: increases are shown with red colors, decreases are shown in blue.
In order to evaluate the simulated percentaged precipitation changes for January and July shown above, it might be helpul to know the "normal" mean rainfall in the different regions for the respective seasons. The following images and the animation concurrently show the simulated precipitation for 1961-1990 and the changes by the end of this century simulated for IPCC scenario A1B.
It can be expected, that a strong decrease in precipitation (yellow to red) will have a strong impact on the vegetation and agriculture, especially in areas with naturally little precipitation (short bars).


