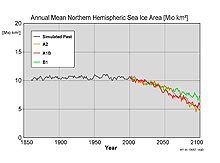
Projected annual mean northern hemispheric sea ice extent for different scenarios  Development of the mean annual sea ice cover for the three scenarios A2, A1B and B1.


The following figures illustrate the seasonal cycle (green) and annual mean (blue) of the sea ice area on the northern hemisphere. When the green field reaches the bottom line of the diagram, the sea ice melts completely during late summer.

Projected northern hemispheric sea ice extent for A2 Projected northern hemispheric sea ice extent for A1B

Projected northern hemispheric sea ice extent for B1

Scenario A2 Scenario A1B Scenario B1


Animations for download

Meereis A2 B1 Film Thumb

Animation: Comparison of the northern hemispheric sea ice and snow cover in March and September for the scenarios A2 and B1. While for A2 the sea ice in summer melts completely, the arctic remains partly covered with ice for B1. (Mpeg1, 2.4 MB)

Meereis A2 Film Thumb Animation: Development of the northern hemispheric sea ice and snow cover in March and September for the scenario A2. (Mpeg1, 2.7 MB)
Meereis A1B Film Thumb

Animation: Development of the northern hemispheric sea ice and snow cover in March and September for the scenario A1B. (Mpeg1, 2.7 MB)

Meereis B1 Film Thumb Animation: Development of the northern hemispheric sea ice and snow cover in March and September for the scenario B1. (Mpeg1, 2.7 MB)