09.10.2019
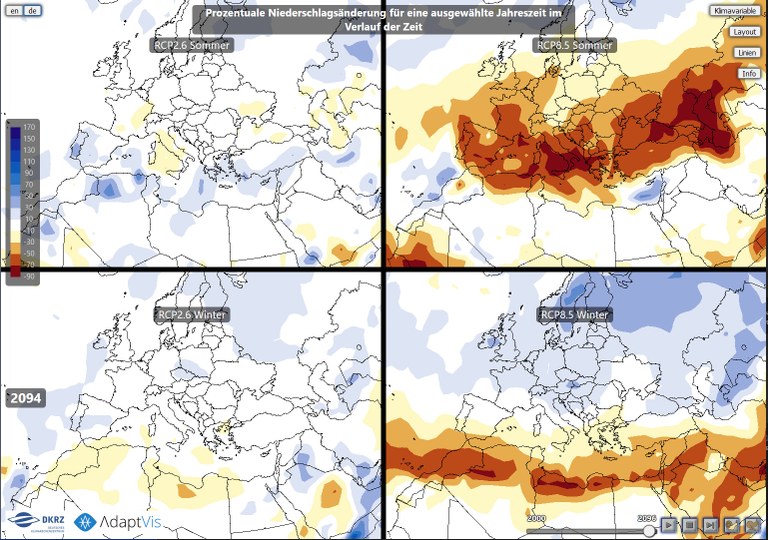
DKRZ has launched a new interactive web visualization platform for climate simulations in order to provide students and other interested parties with a hands-on experience of visualizing current climate projections. The visualization on a rotatable and scalable globe can be interactively controlled: The climate variables available for visualization comprise climate change (temperature, precipitation) for various scenarios and/or seasons, and they can be displayed both comparatively and as an animation over time. This interactivity allows the user to focus, e.g., on a specific region such as the Arctic or Central Europe.
The web visualization platform is based on software created by the company Adaptvis (www.adaptvis.com) and has been created within the scope of an mFUND cooperative project funded by the German Federal Ministry of Transport and Digital Infrastructure (BMVI).
Webvis currently provides mean and seasonal changes in temperature and precipitation for three different scenarios of the future. The data are based on simulations carried out by DKRZ and the Max Planck Institute for Meteorology using the earth system model MPI-ESM that have contributed to the fifth assessment report of the Intergovernmental Panel on Climate Change (IPCC). The three scenarios available in Webvis (RCP2.6: 2-degree target, RCP4.5: delayed climate protection, RCP8.5: business as usual) represent the scope of possible future developments and the resulting climate change. However, the climate change that we are going to experience in the future will, of course, depend on the path we choose globally.
As the 3D technology employed is based on WebGL, a computer with up-to-date hardware and software (web browser: Firefox, Chrome or Opera) is required on the client side. Unfortunately it is currently not possible to use Webvis in a browser on mobile devices.
- Webvis (https://webvis.dkrz.de)
- Further information on the RCP scenarios is available at: www.dkrz.de/communication/climate-simulations/cmip5-ipcc-ar5/szenarien-en?set_language=en&cl=en
- Additional information on the CMIP5 simulations for the fifth IPCC assessment report can be accessed at: www.dkrz.de/communication/climate-simulations/cmip5-ipcc-ar5/AR5-CMIP5-en?set_language=en&cl=en