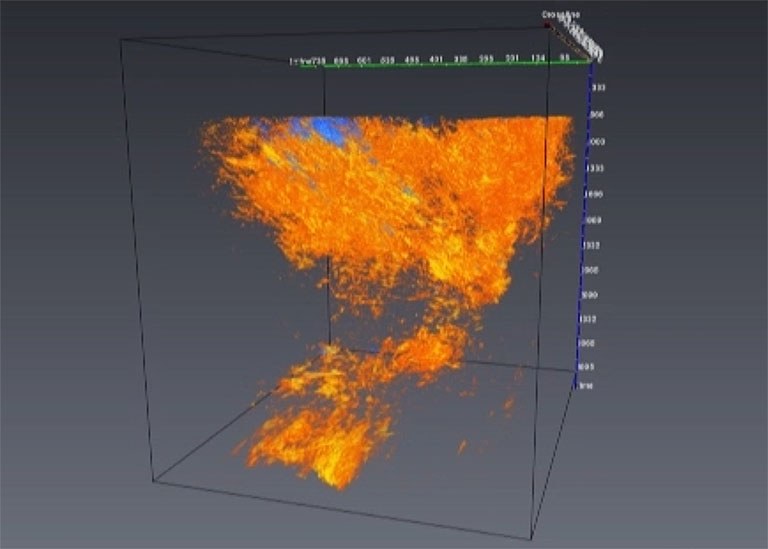
The following animation shows the 3D coherence cube after post-stack Kirchhoff time migration. The first 650 ms of data contain migration artifacts with negative coherence values and are therefore not shown. For the visualization we chose a colormap with a transparency lookup table to map only selected amplitude ranges to opacity.
Volume rendering is an especially useful technique for displaying three-dimensional structures in the coherence cube. It reveals inclined structures and a cluster of high amplitude values in the northern part of the data cube, at high crossline and low inline numbers. The animated, transparent slices shown next allow the viewer to take a tour through the interior of these structures. In addition, inline slices no. 300 to 330 show conjugated fault structures that are approximately perpendicular to the aforementioned structures.