For ScenarioMIP, the part of the international Coupled Model Intercomparison Project 6 (CMIP6) of the World Climate Research Programme (WCRP) that comprises scenario runs for the 21st century, a new set of scenarios has been developed. The new scenarios represent different socio-economic developments as well as different pathways of atmospheric greenhouse gas concentrations.
Using a predefined subset of these scenarios, climate research institutes all over the world have performed climate change simulations for CMIP6. The simulation results will primarily serve as a basis for the sixth assessment report of the Intergovernmental Panel on Climate Change (IPCC AR6), which will be published in 2021.
From narratives to scenarios
Five narratives describing different development paths of society were designed and form the basis of the so-called SSP scenarios (Shared Socioeconomic Pathways):
SSP1: The sustainable and “green” pathway describes an increasingly sustainable world. Global commons are being preserved, the limits of nature are being respected. The focus is more on human well-being than on economic growth. Income inequalities between states and within states are being reduced. Consumption is oriented towards minimizing material resource and energy usage.
SSP2: The “Middle of the road” or medium pathway extrapolates the past and current global development into the future. Income trends in different countries are diverging significantly. There is a certain cooperation between states, but it is barely expanded. Global population growth is moderate, leveling off in the second half of the century. Environmental systems are facing a certain degradation.
SSP3: Regional rivalry. A revival of nationalism and regional conflicts pushes global issues into the background. Policies increasingly focus on questions of national and regional security. Investments in education and technological development are decreasing. Inequality is rising. Some regions suffer drastic environmental damage.
SSP4: Inequality. The chasm between globally cooperating developed societies and those stalling at a lower developmental stage with low income and a low level of education is widening. Environmental policies are successful in tackling local problems in some regions, but not in others.
SSP5: Fossil-fueled Development. Global markets are increasingly integrated, leading to innovations and technological progress. The social and economic development, however, is based on an intensified exploitation of fossil fuel resources with a high percentage of coal and an energy-intensive lifestyle worldwide. The world economy is growing and local environmental problems such as air pollution are being tackled successfully.

These basic pathways had initially not assumed any climate policies exceeding current measures or a necessity for adaptation measures to continuous climate change. Simulations with IAMs (“Integrated Assessment Models”), simple integrated impact assessment models simulating the interplay of the economy, society and the earth system) have shown that the greenhouse gas concentration pathways described in the RCP scenarios (Representative Concentration Pathways, Van Vuuren et al., 2011) used for CMIP5 as well as the respective climate targets such as the 2°C target are unattainable like this. This is due to the strong climate effect of the resulting greenhouse gas concentrations. In order to incorporate the climate policies needed to meet the targets, additional “Shared Climate Policy Assumptions” (SPAs, see Kriegler et al., 2014) were designed. These SPAs describe different degrees of political efforts to curb and to adapt to climate change.
Without additional climate protection measures, the socioeconomic pathways SSP1 and SSP2 would yield an additional radiative forcing of approx. 5 W/m² or 6.5 W/m² (Riahi et al., 2017), respectively.
In order to structure the variety of possible scenarios, three substantial factors were eventually employed: the degree of climate change or rather the intensity of the additional radiative forcing (due to the man-made greenhouse gas effect), the different socioeconomic pathways (SSP1-SSP5) and, if required, SPAs. The classes of climate effecst (radiative forcings) employed roughly correspond to RCP scenarios RCP2.6, RCP4.5, RCP6.0 and RCP8.5, complemented by a few additional classes. Combining the five pathways with the different climate forcings yields a scenario matrix (Figure 1).
The use of comparable developments of radiative forcing allows for a direct comparison of CMIP5 and CMIP6 simulations. In contrast to RCP scenarios, the new SSP-based scenarios provide economic and social reasons for the assumed emission pathways and changes in land use. Moreover, updated historic emissions of greenhouse gases and aerosols as well as land use changes were incorporated, and improved IAMs were used.
Standard scenarios in ScenarioMIP

For ScenarioMIP, a global agreement on four combinations as standard scenarios (“Tier 1”) was reached. The four combinations, which are shown in Figure 2, were therefore simulated at DKRZ in the scenario runs funded by the Federal Ministry of Education and Research (BMBF) within the scope of project CMIP6-DICAD, spanning a time period up to the year 2100.
The denomination of individual scenarios comprises the name of the basic pathway followed by two numerals indicating the additional radiative forcing achieved by the year 2100 in units of tenths of watts.

SSP245: As an update to scenario RCP4.5, SSP245 with an additional radiative forcing of 4.5 W/m² by the year 2100 represents the medium pathway of future greenhouse gas emissions. This scenario assumes that climate protection measures are being taken.
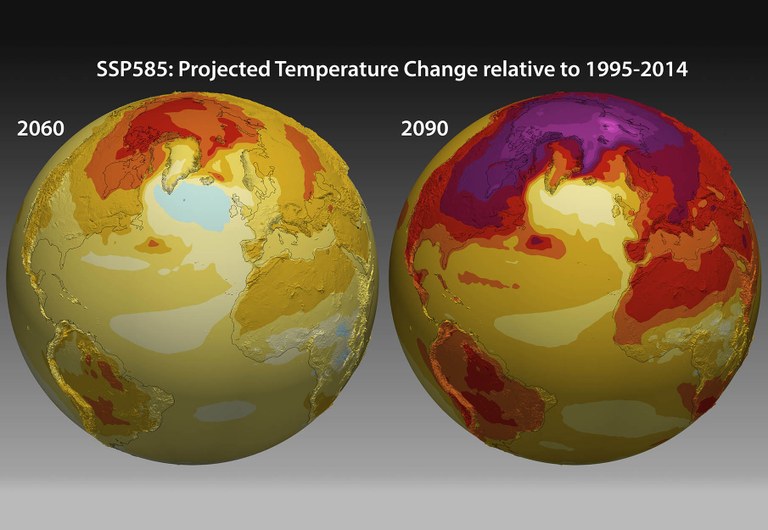
- SSP585: With an additional radiative forcing of 8.5 W/m² by the year 2100, this scenario represents the upper boundary of the range of scenarios described in the literature. It can be understood as an update of the CMIP5 scenario RCP8.5, now combined with socioeconomic reasons.
- SSP370: With 7 W/m² by the year 2100, this scenario is in the upper-middle part of the full range of scenarios. It was newly introduced after the RCP scenarios, closing the gap between RCP6.0 and RCP8.5.
- SSP126: This scenario with 2.6 W/m² by the year 2100 is a remake of the optimistic scenario RCP2.6 and was designed with the aim of simulating a development that is compatible with the 2°C target. This scenario, too, assumes climate protection measures being taken.
In Figure 3, the temporal development of additional man-made radiative forcing resulting from the selected scenarios is depicted. Compared to the preindustrial level, the radiative forcing of today has risen by 2.5 Watts, which approximates to the electrical power needed for a modern bicycle headlight - one per square meter of the Earth's surface! The corresponding trends in the global CO2 concentrations shown in Figure 4 look very similar.


Based on computations with IAM models, Figure 5 shows the emission trajectories corresponding to the four different trajectories of global CO2 concentrations. For the past, the historic emission trajectory is depicted. According to this figure it would be necessary to start reducing emissions immediately, and to even reach negative emissions on a global average by 2075 in order to ensure a radiative forcing compatible with the 2°C target by the year 2100 (SSP126, green curve).
Authors: Michael Böttinger, Dr. Dieter Kasang
Literature:
O’Neill et al. 2016: The Scenario Model Intercomparison Project (ScenarioMIP) for CMIP6, Geosci. Model Dev., 9, 3461–3482, 2016, doi:10.5194/gmd-9-3461-2016
Riahi et al. 2017: The Shared Socioeconomic Pathways and their energy, land use, and greenhouse gas emissions implications: An overview, Global Environmental Change 42 (2017) 153–168, doi:10.1016/j.gloenvcha.2016.05.009
Kriegler et al., 2014: A new scenario framework for climate change research: the concept of shared climate policy assumptions, Climatic Change (2014) 122:401–414, doi:10.1007/s10584-013-0971-5
Van Vuuren et al., 2013: A new scenario framework for Climate Change Research: scenario matrix architecture, Climatic Change, volume 122, pages373–386(2014), doi:10.1007/s10584-013-0906-1
Van Vuuren et al., 2011: The representative concentration pathways: an overview, Climatic Change volume 109, Article number: 5 (2011), doi:10.1007/s10584-011-0148-z