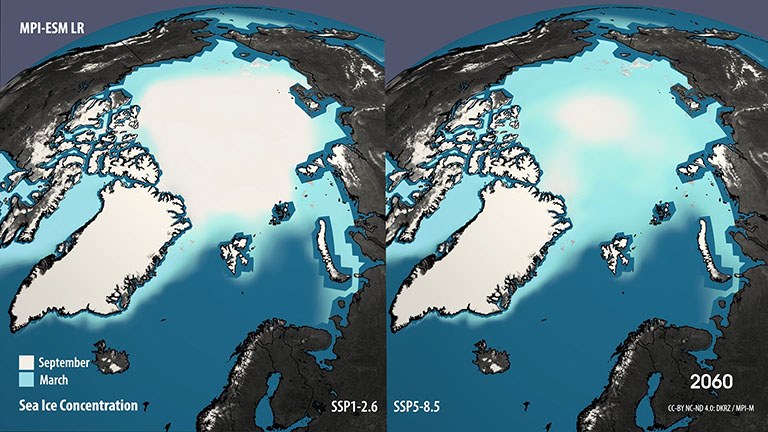
 These visualizations based on the Hamburg CMIP6 simulations show how total sea ice area could develop in each of the northern (top halves of the image) and southern (bottom halves of the image) hemispheres for the different SSP scenarios. The decrease of the sea ice area size can clearly be seen in all scenarios. In particular, for the summers (September), the simulations with both MPI-ESM models project a complete melting of Arctic sea ice from 2060-2070 for the more pessimistic scenarios.
The simulations with the higher-resolution model MPI-ESM HR (figure on the right) show a significantly higher variability here than the simulations with lower-resolution MPI-ESM LR (figure on the left). This is due to the fact that with the higher resolution version - apart from scenario SSP3-7.0 - only one or two realizations of each scenario were simulated, while with the lower resolution LR model version ensembles with 10 realizations each were calculated and the ensemble mean can be seen.
In the following, animations for both model versions show how the sea ice cover in September, the month with the smallest sea ice area in the northern hemisphere, and in March, the month with the largest Arctic sea ice cover, could develop in the future for different scenarios.