In this experiment, the ECHAM5/MPIOM climate model (T31L19-GR3.0L40) and the SICOPOLIS Greenland inland ice model with a 10 km resolution were coupled.
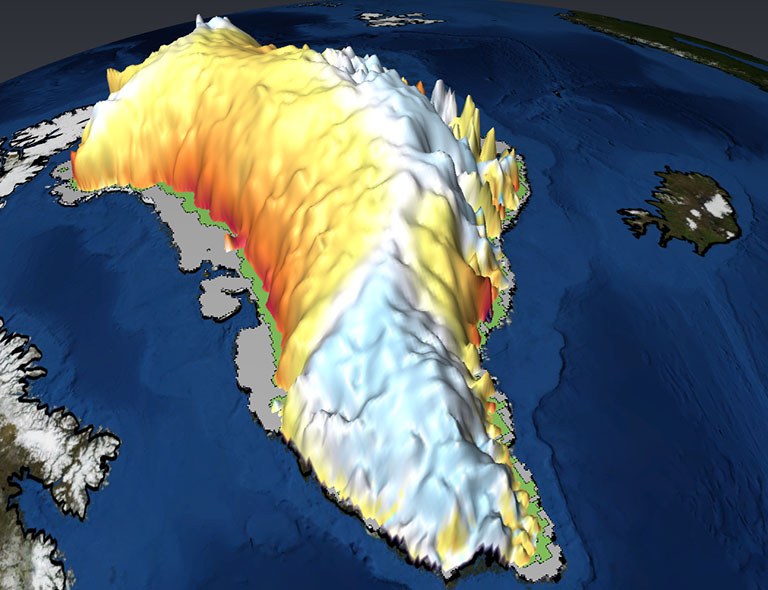
The visualization below shows how Greenland’s ice sheet could develop over the course of the next 300 years, if greenhouse gas concentrations continue to rise as scenario RCP8.5 dictates, in which the values would reach 1120 ppm CO2 – four times the pre-industrial value of 280 ppm. From this point on, the concentration is maintained at 1120 ppm.
The animation shows the simulated development of the ice sheet thickness in the time frame from 1850 to 2300. The presented height of the ice sheet only shows its current thickness, not including the underlying orography. In order to better visualize the change in thickness, the body of ice is shown in different colors, with red representing a decline and blue representing an increase. Areas that are already ice free are shown in grey, and areas that are to become ice free due to melting are shown in green.
According to this simulation, the resulting contribution of melt water to the sea level rise is about 6cm by the year 2100. In the long run, this contribution will continue to rise so that it reaches about 54 cm by 2300.
Data: Uwe Mikolajewicz (MPI-M) and Miren Vizcaino (TU Delft)