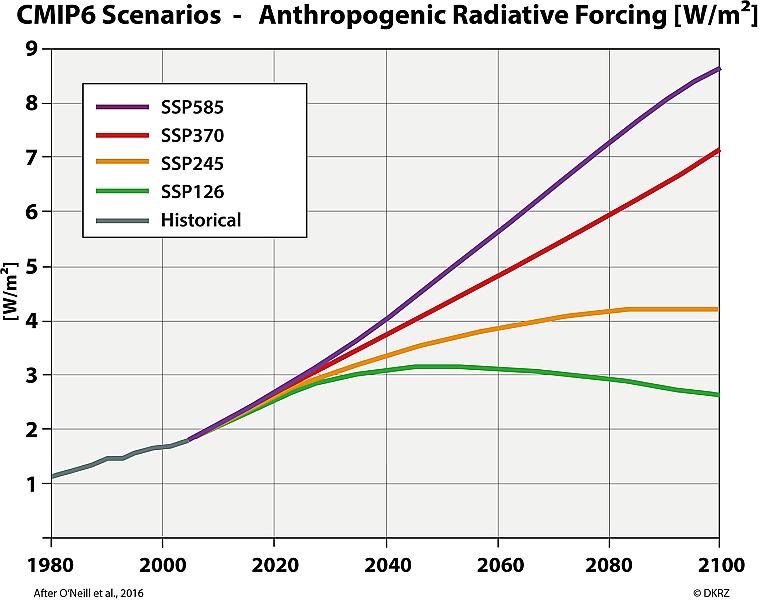
Figure 3: The lines depict the development of the additional greenhouse-gas induced radiative forcing of the past (gray) and for the four SSP scenarios (green, yellow, red, purple).
Radiative ForcingFigure 3: The lines depict the development of the additional greenhouse-gas induced radiative forcing of the past (gray) and for the four SSP scenarios (green, yellow, red, purple).https://www.dkrz.de/bilder/bilder-cmip6/radiative-forcing/viewhttps://www.dkrz.de/bilder/bilder-cmip6/radiative-forcing/@@images/image-1200-c8c24a6fef42b99eefb454e5471d5cc5.jpeg
