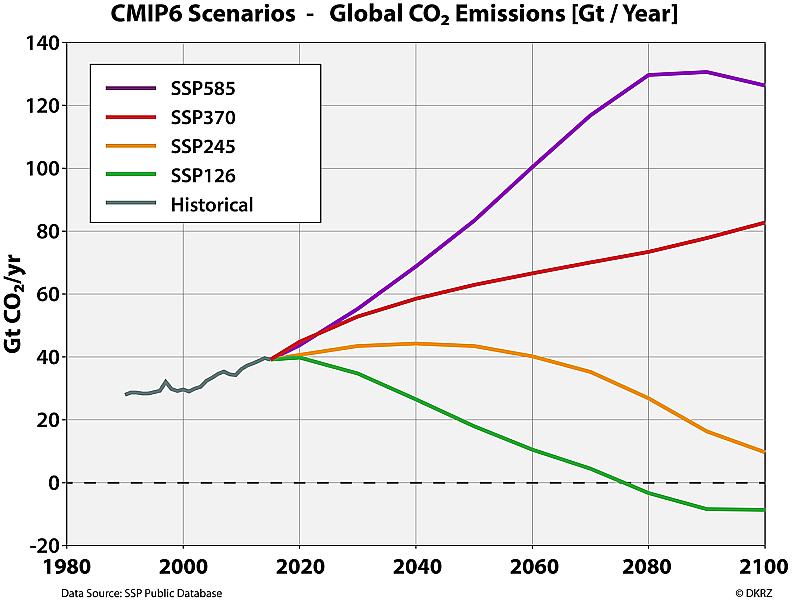
Figure 5: The different developments of the CO2 emissions simulated with IAM models illustrate the amount of "allowed" emissions that correspond the the respective developments of the radiative forcing for the different SSPs.
CO2 EmissionsFigure 5: The different developments of the CO2 emissions simulated with IAM models illustrate the amount of "allowed" emissions that correspond the the respective developments of the radiative forcing for the different SSPs. https://www.dkrz.de/bilder/bilder-cmip6/co2-emissions/viewhttps://www.dkrz.de/bilder/bilder-cmip6/co2-emissions/@@images/image-1200-c8c24a6fef42b99eefb454e5471d5cc5.jpeg
