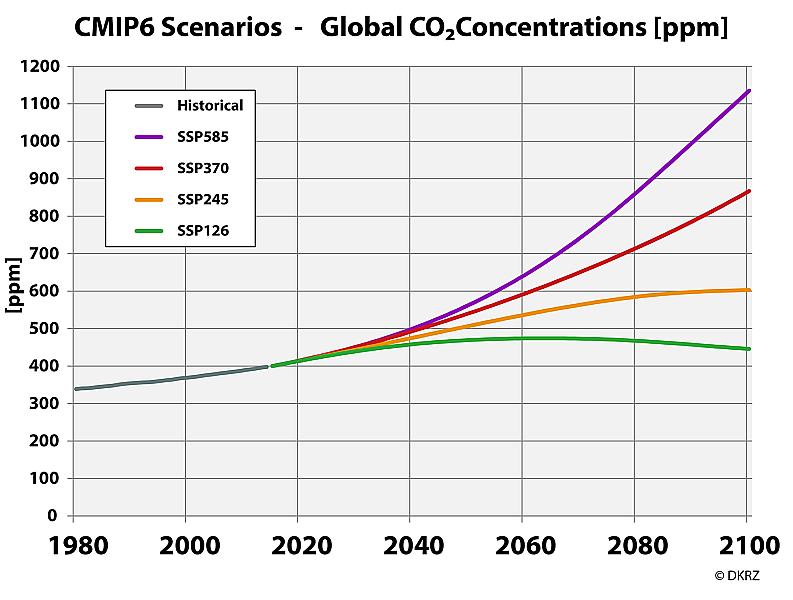
Figure 4: The gray line depicts the past increase in the mean CO2 concentration; the colored lines show the development of the mean CO2 concentration corresponding to the SSP scenarios.
CO2 ConcentrationsFigure 4: The gray line depicts the past increase in the mean CO2 concentration; the colored lines show the development of the mean CO2 concentration corresponding to the SSP scenarios. https://www.dkrz.de/bilder/bilder-cmip6/co2-concentrations/viewhttps://www.dkrz.de/bilder/bilder-cmip6/co2-concentrations/@@images/image-1200-c8c24a6fef42b99eefb454e5471d5cc5.jpeg
