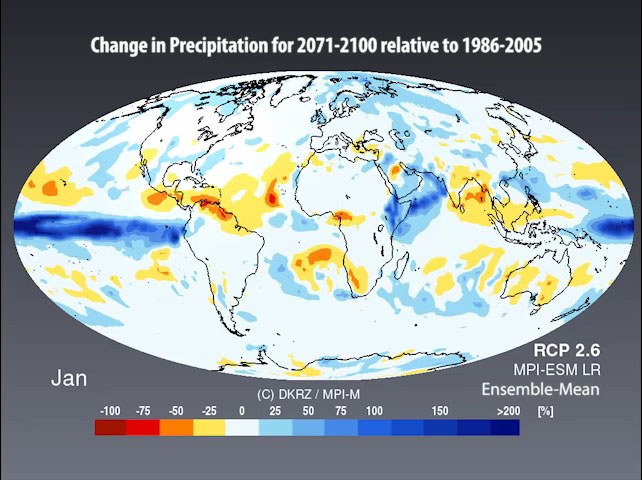
Due to the temperature increase, the water cycle is intensified, causing an increase in global mean precipitation as well. At the same time, however, there is a redistribution causing some areas to receive more precipitation and others less, depending on the season.
| RCP2.6 |
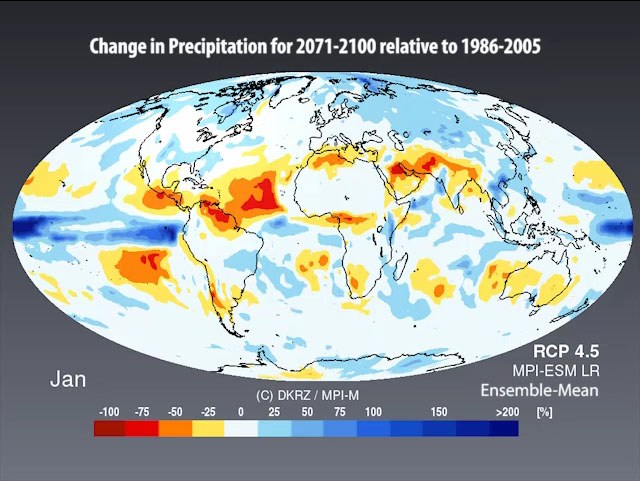
RCP4.5 |
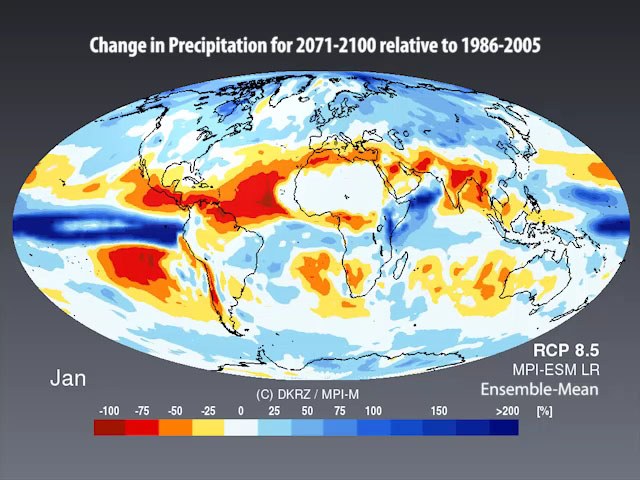
RCP8.5 |
 |
 |
 |
Above: Based on the ensemble averages of the LR runs, the figures show the changes in precipitation for the mean summer and winter seasons of 2071-2100 as compared to 1986-2005 . They show that stronger temperature changes tend to cause greater precipitation anomalies. On the left, in scenario RCP2.6, the strongest changes occur over the ocean, but there are also several land areas that experience a precipitation change with a difference of up to 25%. For scenario RCP4.5, noticeably stronger precipitation changes are simulated, showing, for example, a >25% decrease in precipitation in both the summer and winter months in the Mediterranean Sea area. In the pessimistic RCP8.5 scenario, this trend is augmented to show even more drastic changes.
Animations
The following animations show the seasonal cycle of the mean precipitation change (given in percent) for the end of this century relative to the end of the last century as simulated with MPI-ESM LR. The red areas depict a decrease in the mean monthly precipitation, whereas blue areas represent an increase.