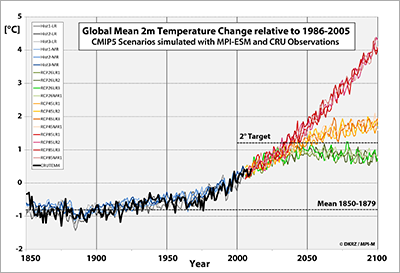
 The figure at right shows the global mean 2m-temperature change for 1850-2100 with respect to the 1986-2005 time period. Two different MPI-ESM configurations were used for the simulation of the historical past and possible future developments. The historical time period from 1850-2000 was simulated as an ensemble of three realizations each with LR and MR model configurations, whereas the 2001-2100 time period for the three RCP Scenarios 2.6, 4.5, and 8.5 was calculated three times with LR and only once with MR.
The thick black line shows the global mean changes in 2m-temperature from 1851-2010 based on the observational CRUTEM4 data set compiled by the Climate Research Unit of the University of East Anglia.
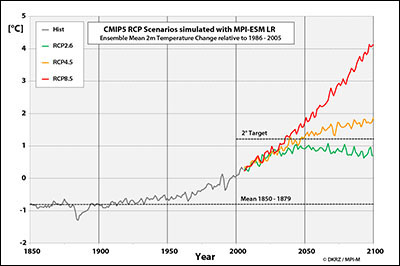
The second figure shows the simulated global mean temperature anomaly relative to 1986-2005 for each of the three scenarios and the historical past, all based on the average of the three LR realizations. In comparison to the time period between 1986 and 2005,  RCP8.5 reaches a temperature increase of nearly 4 degrees by the year 2100. Compared to the pre-industrial state, the global mean experienced a total temperature difference of approximately 4.8 degrees. RCP2.6 on the other hand simulates a global mean warming that remains clearly under the 2 degree goal (less than 2 degrees compared to the pre-industrial state. For the “middle” RCP4.5 scenario, the temperature increase changes less than 2 degrees as compared to 1986-2005, but is still distinctly above the 2 degree goal.
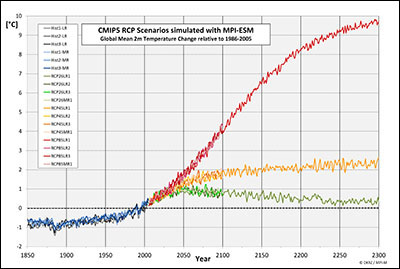
For the extended scenarios up to 2300 in the so-called ECPs, the changes in the scenario-controlled requirements for the simulated climate impact prove to be significantly more extreme. The figure at right depicts the temperature curves for the three calculated realizations, RCP scenarios, and the calculated past for the 2005-2100 time period. For the time from 2101 to 2300, only one realization was simulated for each additional ECP scenario.
 While ECP2.5 manages to slightly decrease towards the 2050 temperature level, ECP4.5 and ECP8.5 show a further temperature increase between 2100 and 2300. In ECP4.5, this increase reaches approximately 2.3 degrees by 2300 compared to 1986-2005, while in the ECP8.5 scenario, it increases by nearly 10 degrees!
